16
$\begingroup$

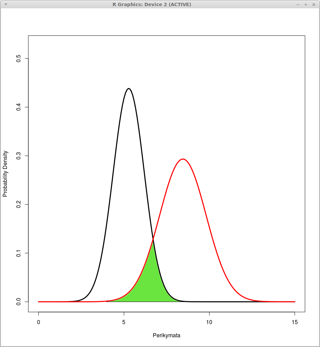
I have two normal distributions defined by their averages and standard deviations.

Sample 1: Mean=5.28; SD=0.91

Sample 2: Mean=8.45; SD=1.36

You can see how they look like in the next image:

enter image description here

How can I get the probability to obtain an individual from the overlapping area (green)? Is the probability the same as the area?

$\endgroup$
7
  • 1
    $\begingroup$ What do you mean by the probability of obtaining an individual from the area? $\endgroup$ Commented Jun 18, 2014 at 8:37
  • 2
    $\begingroup$ If you sample points from either normal distribution, you get points on the Perikymata-axis rather than on the 2-dimensional area. Furthermore, the green zone is infinitely wide, so all values sampled from either distribution are under the green zone, so in this sense the probability would be 1. $\endgroup$ Commented Jun 18, 2014 at 8:47
  • $\begingroup$ @JuhoKokkala OP likely means integral over the green area. $\endgroup$ Commented Nov 21, 2017 at 18:40
  • $\begingroup$ @VladislavsDovgalecs What would the question "Is the probability the same as the area" then mean? $\endgroup$ Commented Nov 21, 2017 at 19:21
  • 1
    $\begingroup$ @VladislavsDovgalecs I think you misunderstood my comment, I was not asking for an interpretation of the area but trying to parse the question. In any case, please note OP's comments to the accepted answer and a followup question posted here stats.stackexchange.com/questions/103821. $\endgroup$ Commented Nov 23, 2017 at 6:14

4 Answers 4

32
$\begingroup$

It is not quite clear what you mean by probability to obtain an individual from the overlapping area. This solves for the area of the green zone in your diagram:

Let:

  • $X_1 \sim N(\mu_1,\sigma_1^2)$ with pdf $f_1(x_1)$ and cdf $ F_1(x_1)$ and

  • $X_2 \sim N(\mu_2,\sigma_2^2)$ with pdf $f_2(x_2)$ and cdf $ F_2(x_2)$,

where $\mu_1 < \mu_2$. In your example, the 'black variable' corresponds to $X_1$.

Let $c$ denote the point of intersection where the pdf's meet in the green zone of your plot Then, the area of your green intersection zone is simply:

$$P(X_1>c) + P(X_2<c) = 1 - F_1(c) + F_2(c) = 1-\frac{1}{2} \text{erf}\left(\frac{c-\mu _1}{\sqrt{2} \sigma _1}\right)+\frac{1}{2} \text{erf}\left(\frac{c-\mu _2}{\sqrt{2} \sigma _2}\right)$$

where erf(.) is the error function.

Point $c$ is the solution to $f_1(x) = f_2(x)$ within the green zone, which yields:

$$c = \frac{\mu _2 \sigma _1^2-\sigma _2 \left(\mu _1 \sigma _2+\sigma _1 \sqrt{\left(\mu _1-\mu _2\right){}^2+2 \left(\sigma _1^2-\sigma _2^2\right) \log \left(\frac{\sigma _1}{\sigma _2}\right)}\right)}{\sigma _1^2-\sigma _2^2}$$

For your example, with $ {\mu_1 = 5.28, \mu_2 = 8.45, \sigma_1 = 0.91, \sigma_2 = 1.36}$, this yields: $c = 6.70458...$,

and the area of the green section is: 0.158413 ...


$\endgroup$
18
  • 1
    $\begingroup$ @antecessor Depends on what you mean by 'overlapping among both'. In the question you talk about some probability, but it is unclear what probabilistic interpretation the area computed here would have. $\endgroup$ Commented Jun 18, 2014 at 8:57
  • 1
    $\begingroup$ @JuhoKokkala Ok, I will write a new question to address the exact question. $\endgroup$
    – antecessor
    Commented Jun 18, 2014 at 10:38
  • 1
    $\begingroup$ the resolution of the equation pdf1=pdf2 yields to two solutions, so we have two intersection points, why you delete the other point @wolfies $\endgroup$
    – user61828
    Commented Dec 1, 2014 at 11:51
  • 5
    $\begingroup$ Is the equation for c given at the bottom of the answer correct? If both distributions have equal variance, the equation requires dividing by zero! $\endgroup$
    – sammosummo
    Commented Mar 21, 2018 at 21:28
  • 3
    $\begingroup$ @sammosummo The equation for $c$ is correct given that $\sigma_1 \neq \sigma_2$. In case of equal variances, $c=\frac{\mu_1+\mu_2}{2}$. $\endgroup$
    – corey979
    Commented Nov 11, 2018 at 20:11
7
$\begingroup$

There are two scenarios when calculating the intersections of two normal distributions. It's important to acknowledge that, in most cases, there are two intersection points:

Equal variance

In the modelled (or rare) examples when two normal distribution curves have exactly the same variance, there is one intersection point. The intersection point on the abscissa axis, $(x_1)$, is calculated from:

$$x_1=\frac{\mu_a+\mu_b}{2}$$

This being, of course, the midpoint between the respective means.

Unequal Variance

When the two normal distribution curves intersect and have different variances, the solution to the intersection points simplifies to a quadratic form. The consequence of the quadratic form is that there are always two intersection points $(x_1,x_2)$ on the abscissa axis.

The intersection points of the two curves can be solved algebraically to obtain the quadratic form and the roots can then be found using the quadratic formula. It’s not as hard as it seems and does not involve using the error function. However, for time and space, I give Inman and Bradley’s version where the intersection points can be found directly.

$$(x_1,x_2)=\frac{\mu_a \sigma_b^2-\mu_b \sigma_a^2\pm\sigma_a \sigma_b \sqrt{(\mu_a-\mu_b)^2+(\sigma_b^2-\sigma_a^2)\ \ln \left(\frac{\sigma_b^2}{\sigma_a^2}\right)}}{\sigma_b^2-\sigma_a^2}$$

Where $-\infty<{x_1}<{x_2}<\infty$. (For ease of calculation, I set $\sigma_b>\sigma_a$ ).

For some intersecting normal distributions with unequal variances, the ‘second’ intersection point maybe insignificant and can, effectively, be ignored. However, for most cases – especially when $\mu_a\approx\mu_b$ – having both intersection points are critical to determine the ‘common area’ (overlap).

Finding the Area

The common area (overlap), $\phi$, is calculated from:

Equal variance $$\phi=\min\left[\int_{-\infty}^{x_1} f(a) dx, \int_{-\infty}^{x_1} f(b) dx\right]+\min\left[\int_{x_1}^{\infty} f(a) dx, \int_{x_1}^{\infty} f(b) dx\right]$$

Where, of course, ${f(a)}=\frac{1}{\sigma_a \sqrt{2 \pi}} e^{-0.5 \left(\frac{x-\mu_a}{σ_a}\right)^2}$

Unequal variance

$$\phi=\min\left[\int_{-\infty}^{x_1} f(a) dx, \int_{-\infty}^{x_1} f(b) dx\right]+\min\left[\int_{x_1}^{x_2} f(a) dx, \int_{x_1}^{x_2} f(b) dx\right]+\min\left[\int_{x_2}^{\infty} f(a) dx, \int_{x_2}^{\infty} f(b) dx\right]$$

Answer

Inserting the data from the question, $\mu_a=5.28, \sigma_a=0.91$ and $\mu_b=8.45, \sigma_b=1.36$, we get $x_1=-1.2842, x_2=6.7046$ and $\phi=0.1548$

Reference:

Inman, H.F. & Bradley Jr, E.L. (1989). The overlapping coefficient as a measure of agreement between probability distributions and point estimation of the overlap of two normal densities, Communications in Statistics - Theory and Methods, 18:10, 3851-3874, DOI: 10.1080/03610928908830127
$\endgroup$
3
  • $\begingroup$ It seems to me that you are answering a different question than that posed by the OP. The OP seeks the probability an individual is in the overlapping area (green). The curves overlap everywhere (one curve is always higher than the other), so the meaning of the question is conveyed by the diagram and the question only considers the main intersection point, closest to the mean. You consider a different problem, with a different meaning of overlapping. Moreover, if one does a diagram of your different problem, there are multiple ways of depicting the green zone, none of which are the OPs. $\endgroup$
    – wolfies
    Commented Apr 17, 2022 at 13:45
  • 3
    $\begingroup$ @wolfies. To answer your first sentence. No I am not answering a different question. The OP question is very clear. $\endgroup$
    – Mari153
    Commented Apr 17, 2022 at 18:32
  • $\begingroup$ This is a better answer than the top one. There are indeed always 2 intersection points. The answer from wolfies correctly identifies only one of them. $\endgroup$
    – johann
    Commented Oct 19, 2023 at 18:25
3
$\begingroup$

@abdelbasset, To improve @wolfies 's answer above, there are two intersection points c, let's call them c1 and c2. Here, c1=-1.2848 and c2=6.7046. @wolfies ignored c1 (it likely will be too far in the tails of the probability density functions to matter (especially if we round to just a few decimal points)).

The more correct way is to find both c1 and c2, and to find the area of overlap of both functions:

AREA OF OVERLAP = P(X1 > j1) + P(X2 < j1) - [P(X2 < j2)-P(X1 < j2)]
therefore, using cdf's
AREA OF OVERLAP = 1 - F1(j1,μ2,σ2)+F2(j1,μ2,σ2)-F2(j2,μ2,σ2)+F1(j2,μ1,σ1)

$\endgroup$
1
  • 1
    $\begingroup$ Welcome to the site, @luckapani. You cannot use the "Your Answer" field to comment or respond to comments. As a result, this would be deleted. However, there is the core of an answer here. Can you edit your post to make it more of an answer & not a comment? Since you're new here, you may want to take our tour, which contains information for new users. $\endgroup$ Commented May 19, 2015 at 16:12
0
$\begingroup$

Normalise the graphs to an area of 1 by dividing each by their respective standard deviation. Then use simple subtraction from a z-graph to calculate the probability of an occurrance in that overlap area. No need for erfs.

$\endgroup$
2
  • 3
    $\begingroup$ i assume that he means that he wants to compute the probability in the green region. That can be done simply by adding the area in the right tail of the first distribution to the ares in the left tail of the second distribution. There is no normalization necessary. $\endgroup$ Commented Nov 2, 2019 at 23:36
  • 1
    $\begingroup$ The separate normalization of the two graphs will change the overlap area unless they have identical SDs. Thus, this answer is generally wrong. $\endgroup$
    – whuber
    Commented Nov 3, 2019 at 13:52

Not the answer you're looking for? Browse other questions tagged or ask your own question.