1
$\begingroup$

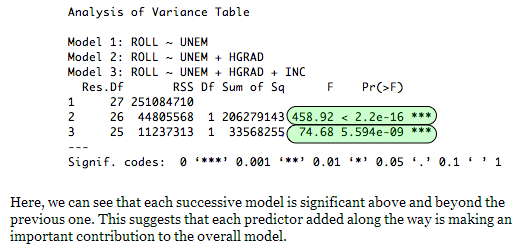
I followed this tutorial to learn Hierarchical Linear Regression (HLR) in R, but couldn't understand how to interpret its sample output of >anova(model1,model2,model3)
enter image description here

The tutorial simply says

each predictor added along the way is making an important contribution to the overall model.

But I would like some more details to quantify the contribution of each explanatory variable, like:

  1. "UNEM" explains X (or X%) variance

  2. Adding the "HGRAD" variable explains Y (or Y%) more variance

  3. Adding the "INC" variable further explains Z (or Z%) more variance

So, can I get the value of X, Y, and Z using the above ANOVA table? How? Specifically, what do Res.Df, RSS, Sum of Sq mean in this ANOVA table?

$\endgroup$

1 Answer 1

0
$\begingroup$

Look at % variance farther up in the tutorial where the R-squared values are reported. You look at the model for the quantity of variance explained and the test (anova) for whether the increase across model complexity is significant.

$\endgroup$
3
  • $\begingroup$ So you are suggesting that I can use >summary(model) for each individual model to see its R-squared (which is the variance explained), and compared the differences between R-squared. Then using >anova(model1, model2, model3), I can further evaluate whether the differences of R-squared are significant. Is this correct? $\endgroup$
    – Ida
    Commented Jun 25, 2014 at 2:33
  • $\begingroup$ Sorry I'm a bit confused about variance and deviance. I already revised my question. $\endgroup$
    – Ida
    Commented Jun 25, 2014 at 2:36
  • $\begingroup$ To your first comment, yes. $\endgroup$
    – John
    Commented Jun 25, 2014 at 2:55

Your Answer

By clicking “Post Your Answer”, you agree to our terms of service and acknowledge you have read our privacy policy.

Not the answer you're looking for? Browse other questions tagged or ask your own question.