12
$\begingroup$

Recently I was present with a task estimation technique. Instead of letting people rate a task for x - amount of hours, I let them discretize tasks into discrete sizes like small / medium / large / x-large. (The tasks are planning poker from scrum for people aware of this.)

After a bit of tracking we should be able to estimate the duration based upon historical data (i.e. statistics). I have been given a set of sample data (real data, but not from my work) and would like see there actually can be made any distribution which fit this. (Of course, I would need to recalculate this for my own tasks.)

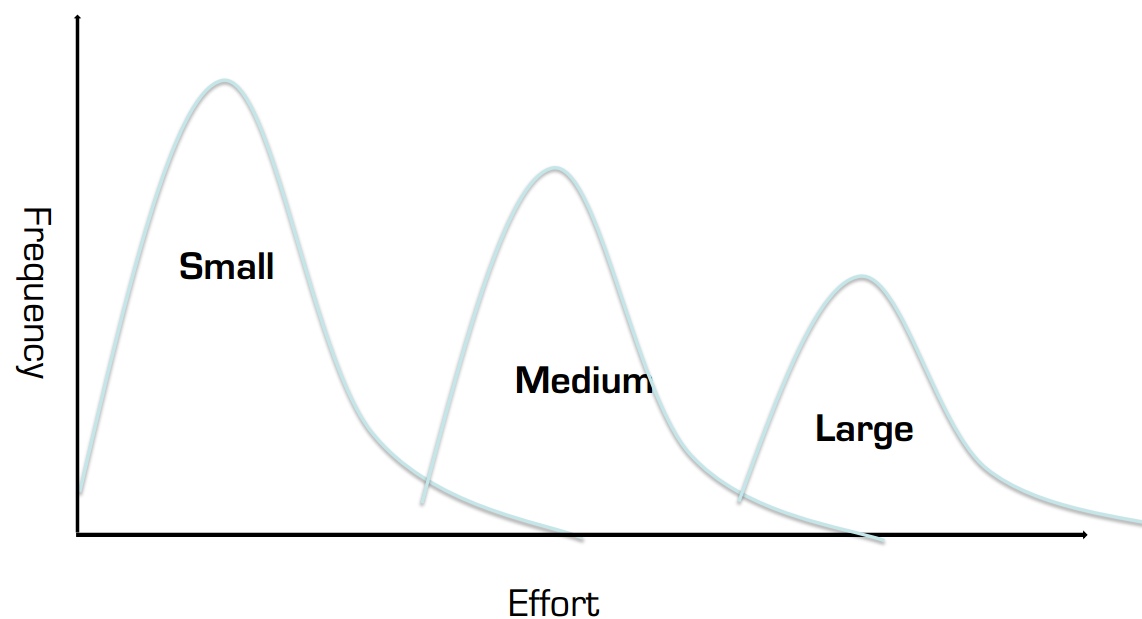
The distributions from the presentations look like this:
enter image description here

It seem like some right skewed distribution. From University, I recall working with a distribution looking like this, but I am not certain about the name. I was hoping for something parametric where I can derive some simple parameters form the data (like mean and variance for a normal distribution)

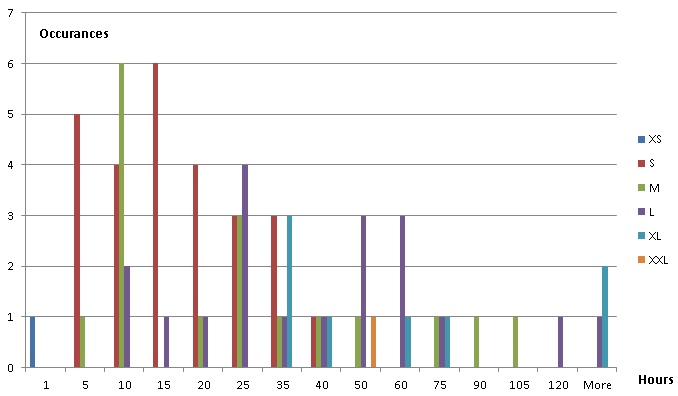
I have made a histogram of the data:
enter image description here

(I know there are too few data.)

$\endgroup$
1
  • 3
    $\begingroup$ Not sure if this is useful, but survival/event history/time before failure models are used to answer the dual questions of whether and when an event occurs. By asking about duration are you trying to answer whether and when a task is completed? If so a survival/event history/time before failure model might be useful. $\endgroup$
    – Alexis
    Commented Jul 27, 2014 at 15:55

2 Answers 2

13
$\begingroup$

Some choices include Weibull, Gamma (including exponential), and lognormal distributions, possibly with a shift-parameter if there's a non-zero minimum possible time. (However from your diagram it looks like there's also potentially a discreteness issue.)

If the presentation drawing is reasonably accurate, a shift-parameter will probably be required.

If there's a tendency for the times to be highly skew, log-logistic, inverse Gaussian or Pareto might be considered. (It doesn't look to be the case here though.)

$\endgroup$
1
  • 1
    $\begingroup$ Thanks for suggestions! Regarding the discreteness issue: I choose some bins for the histogram 1-5, 5-10... and etc. $\endgroup$ Commented Jul 28, 2014 at 20:57
5
$\begingroup$

You might want to try an Erlang distribution. Here are a couple of excerpts from the page:

The distribution is a continuous distribution, which has a positive value for all real numbers greater than zero, and is given by two parameters: the shape $k$, which is a positive integer, and the rate $\lambda$, which is a positive real number

Events that occur independently with some average rate are modeled with a Poisson process. The waiting times between $k$ occurrences of the event are Erlang distributed.

I am not sure if there is a good intuitive explanation about why Erlang would fit here but I'll give it a shot: if you think of each task consisting of smaller subtasks, then you can model this in three ways:

  1. Each subtask takes about same amount of time (so using the notation of the Wikipedia page, the $\mu$ is the same for all tasks but the larger estimates have higher number of subtasks (the $k$ in the Erlang formula).

  2. The converse: each size task has the same number of subtasks but each subtask is longer.

  3. A combination of (1) and (2).

Just be careful in fitting that you have enough historical data to build a decent model without overfitting and kudos to you for applying statistics to Scrum project estimation!

$\endgroup$

Your Answer

By clicking “Post Your Answer”, you agree to our terms of service and acknowledge you have read our privacy policy.

Not the answer you're looking for? Browse other questions tagged or ask your own question.