I have some crime data where the crime rate for a given year in a given town is reported as number of police reports per thousands of people in this town, eg $5/6$ for five reported crimes in a town of 6000 people. In the nature of things there will be some high-variance measurements from small towns and some less-variable measurements from larger towns.
If it was only the number of police reports it would be count data, and I'd figure that the sensible choice would be a Poisson distribution. Is there a similar sort of theoretically founded choice for this count-per-something situation?
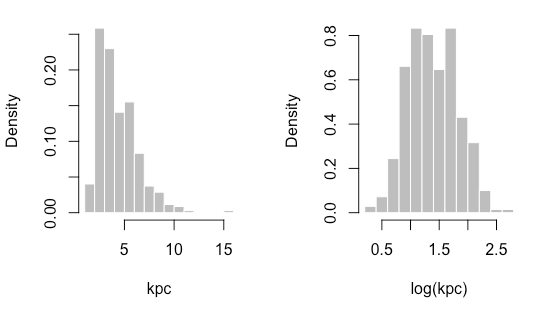
Below is a histogram of the rates and the log of these rates; from these it's kind of tempting to call the data log-normal but I have no theoretical basis for saying so. Further below is a very long string you can copy to get a vector of these rates in R.

rates <- c(15.4, 11.6, 10.9, 10.9, 10.5, 10, 9.8, 9.8, 9.5, 9, 9, 8.9, 8.8, 8.8, 8.7, 8.4, 8.2, 8.2, 8.2, 8, 7.9, 7.9, 7.8, 7.7, 7.6, 7.6, 7.6, 7.5, 7.5, 7.4, 7.4, 7.3, 7, 7, 6.9, 6.9, 6.8, 6.8, 6.8, 6.8, 6.7, 6.7, 6.6, 6.6, 6.5, 6.5, 6.5, 6.4, 6.4, 6.4, 6.3, 6.3, 6.3, 6.3, 6.2, 6.2, 6.2, 6.1, 6.1, 6.1, 6.1, 6, 6, 6, 6, 6, 6, 6, 6, 6, 6, 5.9, 5.9, 5.9, 5.9, 5.9, 5.8, 5.8, 5.8, 5.8, 5.8, 5.7, 5.7, 5.7, 5.6, 5.6, 5.6, 5.5, 5.5, 5.5, 5.5, 5.5, 5.4, 5.4, 5.4, 5.4, 5.4, 5.4, 5.4, 5.4, 5.3, 5.3, 5.3, 5.3, 5.3, 5.3, 5.2, 5.2, 5.2, 5.2, 5.2, 5.2, 5.1, 5.1, 5.1, 5, 5, 5, 5, 4.9, 4.9, 4.9, 4.9, 4.9, 4.8, 4.8, 4.7, 4.7, 4.7, 4.6, 4.6, 4.6, 4.6, 4.5, 4.5, 4.5, 4.5, 4.5, 4.4, 4.4, 4.4, 4.4, 4.3, 4.3, 4.3, 4.3, 4.3, 4.3, 4.3, 4.3, 4.2, 4.2, 4.2, 4.2, 4.2, 4.2, 4.2, 4.2, 4.2, 4.2, 4.1, 4.1, 4.1, 4.1, 4, 4, 4, 4, 4, 4, 4, 4, 3.9, 3.9, 3.9, 3.9, 3.9, 3.9, 3.9, 3.9, 3.8, 3.8, 3.8, 3.8, 3.8, 3.8, 3.7, 3.7, 3.7, 3.7, 3.7, 3.7, 3.7, 3.7, 3.7, 3.6, 3.6, 3.6, 3.6, 3.6, 3.6, 3.6, 3.6, 3.5, 3.5, 3.5, 3.5, 3.5, 3.5, 3.5, 3.5, 3.5, 3.4, 3.4, 3.4, 3.4, 3.4, 3.4, 3.4, 3.4, 3.3, 3.3, 3.3, 3.3, 3.3, 3.2, 3.2, 3.2, 3.2, 3.2, 3.2, 3.2, 3.2, 3.2, 3.2, 3.1, 3.1, 3.1, 3.1, 3.1, 3.1, 3.1, 3.1, 3.1, 3, 3, 3, 3, 3, 3, 3, 3, 3, 3, 2.9, 2.9, 2.9, 2.9, 2.9, 2.9, 2.9, 2.9, 2.9, 2.9, 2.9, 2.9, 2.9, 2.8, 2.8, 2.8, 2.8, 2.8, 2.8, 2.8, 2.8, 2.8, 2.8, 2.8, 2.7, 2.7, 2.7, 2.7, 2.7, 2.7, 2.7, 2.7, 2.7, 2.7, 2.7, 2.6, 2.6, 2.6, 2.6, 2.6, 2.6, 2.6, 2.6, 2.6, 2.6, 2.6, 2.6, 2.5, 2.5, 2.5, 2.5, 2.5, 2.5, 2.5, 2.4, 2.4, 2.4, 2.4, 2.4, 2.3, 2.3, 2.3, 2.3, 2.3, 2.3, 2.3, 2.3, 2.3, 2.3, 2.3, 2.2, 2.2, 2.2, 2.2, 2.2, 2.2, 2.2, 2.2, 2.1, 2.1, 2, 2, 2, 2, 2, 2, 2, 1.8, 1.8, 1.6, 1.5, 1.5, 1.4, 1.4)
