44
$\begingroup$

Benjamini and Hochberg developed the first (and still most widely used, I think) method for controlling the false discovery rate (FDR).

I want to start with a bunch of P values, each for a different comparison, and decide which ones are low enough to be called a "discovery", controlling the FDR to a specified value (say 10%). One assumption of the usual method is that the set of comparisons are either independent or have "Positive dependency" but I can't figure out exactly what that phrase means in the context of analyzing a set of P values.

$\endgroup$
10
  • 1
    $\begingroup$ Thanks for awarding the bounty to my answer, Harvey! Would you say it resolves this issue for you, or are you looking for a more detailed exposition? I noticed that you haven't accepted any answer yet, that's why I would like to clarify. Thanks. Perhaps you can comment or edit your Q to clarify what you would still like to have clarified. $\endgroup$
    – amoeba
    Commented Mar 29, 2017 at 7:14
  • 2
    $\begingroup$ @amoeba. The deadline for the bounty was upon me, and your answer was by far the best. Frankly, it never occurred to me at that moment that giving a bounty wasn't also accepting the answer. But I know those are distinct (I'll blame jet lag). But a full answer really needs to include realistic examples where the set of P values both do and don't have positive dependency. I'll hold off accepting an answer for a week in hopes that someone can give both kinds of examples, so the meaning is clear. $\endgroup$ Commented Mar 29, 2017 at 16:25
  • $\begingroup$ This probably isn't really a satisfying example, but it's really easy to come up with p-values with and without positive dependency if we think about performing one-tailed tests on correlated variables. Imagine I am testing whether A = 0 and also whether B = 0 against one-tailed alternatives (A > 0 and B > 0). Further imagine that B depends on A. For example, imagine I want to know if a population contains more women than men, and also if the population contains more ovaries than testes. Clearly knowing the p-value of the first question changes our expectation of the p-value for the second $\endgroup$ Commented Mar 29, 2017 at 18:02
  • $\begingroup$ Thanks, Harvey. I hope it was clear that I was not trying to push you to accept my answer (!!) but rather to clarify what kind of answer you are looking for in this thread, and what you would still like to have clarified. I am not really an expert on this topic, just trying to make sense of it. $\endgroup$
    – amoeba
    Commented Mar 29, 2017 at 18:03
  • $\begingroup$ Both p-values change in the same direction, and this is PRD. But if I instead test the second hypothesis that population 2 has more testes than ovaries, our expectation for the second p-value decreases as the first p-value increases. This is not PRD. $\endgroup$ Commented Mar 29, 2017 at 18:04

5 Answers 5

28
+200
$\begingroup$

From your question and in particular your comments to other answers, it seems to me that you are mainly confused about the "big picture" here: namely, what does "positive dependency" refer to in this context at all -- as opposed to what is the technical meaning of the PRDS condition. So I will talk about the big picture.

The big picture

Imagine that you are testing $N$ null hypotheses, and imagine that all of them are true. Each of the $N$ $p$-values is a random variable; repeating the experiment over and over again would yield a different $p$-value each time, so one can talk about a distribution of $p$-values (under the null). It is well-known that for any test, a distribution of $p$-values under the null must be uniform; so, in the case of multiple testing, all $N$ marginal distributions of $p$-values will be uniform.

If all the data and all $N$ tests are independent from each other, then the joint $N$-dimensional distribution of $p$-values will also be uniform. This will be true e.g. in a classic "jelly-bean" situation when a bunch of independent things are being tested:

green jelly beans

However, it does not have to be like that. Any pair of $p$-values can in principle be correlated, either positively or negatively, or be dependent in some more complicated way. Consider testing all pairwise differences in means between four groups; this is $N=4\cdot 3/2=6$ tests. Each of the six $p$-values alone is uniformly distributed. But they are all positively correlated: if (on a given attempt) group A by chance has particularly low mean, then A-vs-B comparison might yield a low $p$-value (this would be a false positive). But in this situation it is likely that A-vs-C, as well as A-vs-D, will also yield low $p$-values. So the $p$-values are obviously non-independent and moreover they are positively correlated between each other.

This is, informally, what "positive dependency" refers to.

This seems to be a common situation in multiple testing. Another example would be testing for differences in several variables that are correlated between each other. Obtaining a significant difference in one of them increases the chances of obtaining a significant difference in another.

It is tricky to come up with a natural example where $p$-values would be "negatively dependent". @user43849 remarked in the comments above that for one-sided tests it is easy:

Imagine I am testing whether A = 0 and also whether B = 0 against one-tailed alternatives (A > 0 and B > 0). Further imagine that B depends on A. For example, imagine I want to know if a population contains more women than men, and also if the population contains more ovaries than testes. Clearly knowing the p-value of the first question changes our expectation of the p-value for the second. Both p-values change in the same direction, and this is PRD. But if I instead test the second hypothesis that population 2 has more testes than ovaries, our expectation for the second p-value decreases as the first p-value increases. This is not PRD.

But I have so far been unable to come up with a natural example with point nulls.


Now, the exact mathematical formulation of "positive dependency" that guarantees the validity of Benjamini-Hochberg procedure is rather tricky. As mentioned in other answers, the main reference is Benjamini & Yekutieli 2001; they show that PRDS property ("positive regression dependency on each one from a subset") entails Benjamini-Hochberg procedure. It is a relaxed form of the PRD ("positive regression dependency") property, meaning that PRD implies PRDS and hence also entails Benjamini-Hochberg procedure.

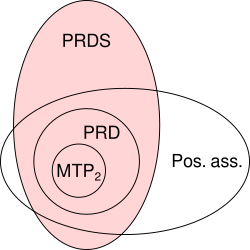
For the definitions of PRD/PRDS see @user43849's answer (+1) and Benjamini & Yekutieli paper. The definitions are rather technical and I do not have a good intuitive understanding of them. In fact, B&Y mention several other related concepts as well: multivariate total positivity of order two (MTP2) and positive association. According to B&Y, they are related as follows (the diagram is mine):

$\hskip{10em}$PRD, PRDS, MTP2, and PA

MTP2 implies PRD that implies PRDS that guarantees correctness of B-H procedure. PRD also implies PA, but PA$\ne$PRDS.

$\endgroup$
7
  • $\begingroup$ Would an example of negative dependency be post hoc pairwise tests following, say, a oneway ANOVA of three groups, where $\mu_{A} < \mu_{B} < \mu_{C}$, but $\bar{x}_{B} < \mu_{B}$, while $\bar{x}_{A}\approx \mu_{A}$, and $\bar{x}_{C}\approx \mu_{C}$, so while $p_{A\text{ vs. }B}$ is less likely to reject (because under $H_{0}$ $|\bar{x}_{A}-\bar{x}_{B}| < |\bar{x}_{B}-\bar{x}_{C}|$), but due to dependency $p_{B\text{ vs. }C}$ is more likely to reject? $\endgroup$
    – Alexis
    Commented Apr 4, 2017 at 20:21
  • 1
    $\begingroup$ @Alexis I was thinking along these lines myself, but I don't think this works because we need to consider what happens under the null. In this case, the null is that $\mu_A=\mu_B=\mu_C$, and so your reasoning breaks down. $\endgroup$
    – amoeba
    Commented Apr 4, 2017 at 20:28
  • $\begingroup$ So, if it is difficult to think of negative dependency situations, then the Benjamini-Hochberg procedure is valid for situations like post hoc pairwise tests following rejection of an omnibus null hypothesis regarding independent groups (e.g. oneway not blocked ANOVA, Cochran's Q, Kruskal-Wallis, etc.)? $\endgroup$
    – Alexis
    Commented Apr 4, 2017 at 20:45
  • $\begingroup$ @Alexis I believe this is correct, yes. I am still trying to come up with a natural example with negative dependency... $\endgroup$
    – amoeba
    Commented Apr 4, 2017 at 20:49
  • $\begingroup$ ROCK! You go, girl! :) (For gender-free meanings of the word "girl" ;). $\endgroup$
    – Alexis
    Commented Apr 4, 2017 at 20:50
20
+50
$\begingroup$

Great question! Let's step back and understand what Bonferroni did, and why it was necessary for Benjamini and Hochberg to develop an alternative.

It has become necessary and compulsory in recent years to perform a procedure called multiple testing correction. This is due to the increasing numbers of tests being performed simultaneously with high throughput sciences, especially in genetics with the advent of whole genome association studies (GWAS). Excuse my reference to genetics, as it is my area of work. If we are performing 1,000,000 tests simultaneously at $P = 0.05$, we would expect $50,000$ false positives. This is ludicrously large, and thus we must control the level at which significance is assessed. The bonferroni correction, that is, dividing the acceptance threshold (0.05) by the number of independent tests $(0.05/M)$ corrects for the family wise error rate ($FWER$).

This is true because the FWER is related to test-wise error rate ($TWER$) by the equation $FWER = 1 - (1 - TWER)^M$. That is, 100 percent minus 1 subtract the test wise error rate raised to the power of the number of independent tests performed. Making the assumption that $(1- 0.05)^{1/M} = 1-\frac{0.05}{M}$ gives $TWER \approx \frac{0.05}{M}$, which is the acceptance P value adjusted for M completely independent tests.

The problem that we encounter now, as did Benjamini and Hochberg, is that not all tests are completely independant. Thus, the Bonferroni correction, though robust and flexible, is an overcorrection. Consider the case in genetics where two genes are linked in a case called linkage disequilibrium; that is, when one gene has a mutation, another is more likely to be expressed. These are obviously not independent tests, though in the bonferroni correction they are assumed to be. It is here where we start to see that dividing the P value by M is creating a threshold that is artificially low because of assumed independent tests which really influence each other, ergo creating an M that is too large for our real situation, where things aren't independent.

The procedure suggested by Benjamini and Hochberg, and augmented by Yekutieli (and many others) is more liberal than Bonferroni, and in fact Bonferroni correction is only used in the very largest of studies now. This is because, in FDR, we assume some interdependence on the part of the tests and thus an M which is too large and unrealistic and getting rid of results that we, in reality, care about. Therefore in the case of 1000 tests which are not independent, the true M would not be 1000, but something smaller because of dependencies. Thus when we divide 0.05 by 1000, the threshold is too strict and avoids some tests which may be of interest.

I'm not sure if you care about the mechanics behind the controlling for dependency, though if you do I have linked the Yekutieli paper for your reference. I'll also attach a few other things for your information and curiosity.

Hope this has helped in some way, if I have misrepresented anything please do let me know.

~ ~ ~

References

Yekutieli paper on positive dependencies -- http://www.math.tau.ac.il/~ybenja/MyPapers/benjamini_yekutieli_ANNSTAT2001.pdf

( see 1.3 -- The Problem. )

Explaination of Bonferroni and other things of interest -- Nature Genetics reviews. Statistical Power and significance testing in large-scale genetic studies -- Pak C Sham and Shaun M Purcell

( see box 3. )

http://en.wikipedia.org/wiki/Familywise_error_rate

EDIT:

In my previous answer I did not directly define positive dependency, which was what was asked. In the Yekutieli paper, section 2.2 is entitled Positive dependence, and I suggest this as it is very detailed. However, I believe that we can make it a little bit more succinct.

The paper at first begins by talking about positive dependancy, using it as a vague term that is interpretable but not specific. If you read the proofs, the thing that is mentioned as positive dependency is called PRSD, defined earlier as "Positive regression dependancy on each one from a subset $I_0$". $I_0$ is the subset of tests that correctly support the null hypothesis (0). PRDS is then defined as the following.

PRDS

$X$ is our whole set of test statistics, and $I_0$ is our set of test statistics which correctly support the null. Thus, for $X$ to be PRDS (positively dependent) on $I_0$, the probability of $X$ being an element of $I_0$ (nulls) increases in non decreasing set of test statistics $x$ (elements of $X$).

Interpreting this, as we order our $P$-values from lowest to highest, the probability of being part of the null set of test statistics is the lowest at the smallest P value, and increases from there. The FDR sets a boundary on this list of test statistics such that the probability of being part of the null set is 0.05. This is what we are doing when controlling for FDR.

In summation, the property of positive dependency is really the property of positive regression dependency of our whole set of test statistics upon our set of true null test statistics, and we control for an FDR of 0.05; thus as P values go from the bottom up (the step up procedure), they increase in probability of being part of the null set.

My former answer in the comments about the covariance matrix was not incorrect, just a little bit vague. I hope this helps a little bit more.

$\endgroup$
14
  • 6
    $\begingroup$ Thanks. You provide a clear overview of controlling family wise error rates (Bonferroni etc.) vs controlling the FDR, but I still don't understand what "positive dependency" means. Consider that I have 1000 P values, testing expression of 1000 different genes comparing people with and without some disease. I use the BH method to decide which of these comparisons are "discoveries". What does "positive dependency" mean in this context? $\endgroup$ Commented Aug 22, 2014 at 13:56
  • 9
    $\begingroup$ A small but important note: Bonferroni makes absolutely no assumption regarding independence. In fact, it will cover correctly in the mutually exclusive case, which, in a way, is about as far from independent as you can get. There is a correction procedure (Sidak) that does assume independence and will more strongly control FWER under that assumption. Afew other aspects of this answer could use some light touch-up as well . $\endgroup$
    – cardinal
    Commented Aug 22, 2014 at 14:42
  • 2
    $\begingroup$ @ChrisC I still don't understand. "Covariance matrix between elements"? I start with a list of P values, and want to decide which are low enough to be called "discoveries" worth following up on (with the FDR controlled). What are the elements of the covariance matrix? Say each P value is comparing expression of a particular gene between groups, and there are many such genes. For each gene, a t test compares the groups resulting in a P value. What does it mean, in this situation, for "elements to vary together" or having "positive correlations between themselves"? $\endgroup$ Commented Aug 23, 2014 at 0:22
  • 2
    $\begingroup$ @ChrisC Thanks. It is become more clear, but I still don't really grasp what this assumption means. The whole point of knowing about the assumption behind the method is to know when you are likely to be violating it. So it would help to list some scenarios where the assumption is not true. When would a lower P value not be associated with a higher probability of the null hypothesis being false? $\endgroup$ Commented Aug 23, 2014 at 14:19
  • 1
    $\begingroup$ This does not answer the question. $\endgroup$
    – Alexis
    Commented Mar 22, 2017 at 19:59
11
$\begingroup$

I found this pre-print helpful in understanding the meaning. It should be said that I offer this answer not as an expert in the topic, but as an attempt at understanding to be vetted and validated by the community.

Thanks to Amoeba for very helpful observations about the difference between PRD and PRDS, see comments

Positive regression dependency (PRD) means the following: Consider the subset of p-values (or equivalently, test statistics) that correspond to true null hypotheses. Call the vector of these p-values $p$. Let $C$ be a set of vectors with length equal to the length of $p$ and let $C$ have the following property:

  1. If some vector $q$ is in $C$, and
  2. We construct some vector $r$ of the same length as $q$ so that all elements of $r$ are less than the corresponding elements of $q$ ($r_i < q_i$ for all $i$), then
  3. $r$ is also in $C$

(This means that $C$ is a "decreasing set".)

Assume we know something about the values of some of the elements of $p$. Namely, $p_1 ... p_{n} < B_1 ... B_n$. PRD means that the probability that $p$ is in $C$ never increases as $B_1 ... B_n$ increases.

In plain language, notice that we can formulate an expectation for any element $p_i$. Since $p_i$ corresponds to a true null, it's unconditional expectation should be a uniform distribution from 0 to 1. But if the p-values are not independent, then our conditional expectation for $p_i$ given some other elements of $p_1 ... p_n$ might not be uniform. PRD means that increasing the value $p_1 ... p_n$ can never increase the probability that another element $p_i$ has lower value.

Benjamini and Yekutieli (2001) show that the Benjamini and Hochberg procedure for controlling FDR requires a condition they term positive regression dependence on a subset (PRDS). PRDS is similar to, and implied by, PRD. However, it is a weaker condition because it only conditions on one of $p_1 ... p_n$ at a time.

To rephrase in plain language: again consider the set of p-values that correspond to true null hypotheses. For any one of these p-values (call it $p_n$), imagine that we know $p_n < B$, where $B$ is some constant. Then we can formulate a conditional expectation for the remaining p-values, given that $p_n < B$. If the p-values are independent, then our expectation for the remaining p-values is the uniform distribution from 0 to 1. But if the p-values are not independent, then knowing $p_n < B$ might change our expectation for the remaining p-values. PRDS says that increasing the value of $B$ must not decrease our expectation for any of the remaining p-values corresponding to the true null hypotheses.

#Edited to add:

Here's a putative example of a system that is not PRDS (R code below). The logic is that when samples a and b are very similar, it is more likely that their product will be atypical. I suspect that this effect (and not the non-uniformity of p-values under the null for the (a*b), (c*d) comparison) is driving the negative correlation in the p-values, but I cannot be sure. The same effect appears if we do a t-test for the second comparison (rather than a Wilcoxon), but the distribution of p-values still isn't uniform, presumably due to violations of the normality assumption.

ab <- rep(NA, 100000)  # We'll repeat the comparison many times to assess the relationships among p-values.
abcd <- rep(NA, 100000)

for(i in 1:100000){
  a <- rnorm(10)    # Draw 4 samples from identical populations.
  b <- rnorm(10)
  c <- rnorm(10)
  d <- rnorm(10)

  ab[i] <- t.test(a,b)$p.value          # We perform 2 comparisons and extract p-values
  abcd[i] <- wilcox.test((a*b),(c*d))$p.value
}

summary(lm(abcd ~ ab))    # The p-values are negatively correlated

ks.test(ab, punif)    # The p-values are uniform for the first test
ks.test(abcd, punif)   # but non-uniform for the second test.
hist(abcd)
$\endgroup$
11
  • $\begingroup$ I'm sorry, but I don't really follow this. $\endgroup$ Commented Mar 26, 2017 at 0:48
  • $\begingroup$ Does the new final paragraph clear it up at all? $\endgroup$ Commented Mar 26, 2017 at 22:14
  • $\begingroup$ @ Amoeba, yeah, I think you're right. The Yekutieli papers linked by previous posters are treatments of PRDS. As far as I can tell, PRD is the same property, but across all of the test statistics (or p-values), not just the subset corresponding to true nulls. $\endgroup$ Commented Mar 26, 2017 at 23:15
  • 1
    $\begingroup$ Yup, you're absolutely right. Editing now. $\endgroup$ Commented Mar 27, 2017 at 14:51
  • 1
    $\begingroup$ Interesting example, but the effect is super-weak: I get correlation coefficient (between ab and abcd) of around -0.03... But I don't get it: why do you say that "when samples a and b are very similar, it is more likely that their product will be atypical"? $\endgroup$
    – amoeba
    Commented Apr 4, 2017 at 19:54
4
$\begingroup$

In their paper, Benjamini and Yekutieli provide some examples of how positive regression dependence (PRD) is different from just being positively associated. The FDR control procedure relies on a weaker form of PRD which they call PRDS (i.e. PRD on each one from a subset of variables).

Positive dependency was originally proposed in the bivariate setting by Lehmann, but the multivariate version of this concept, known as positive regression dependency is what is relevant to multiple testing.

Here is a relevant excerpt from pg.6

Nevertheless, PRDS and positive association do not imply one another, and the difference is of some importance. For example, a multivariate normal distribution is positively associated iff all correlations are nonnegative. Not all correlations need be nonnegative for the PRDS property to hold (see Section 3.1, Case 1 below). On the other hand, a bivariate distribution may be positively associated, yet not positive regression dependent [Lehmann (1966)], and therefore also not PRDS on any subset. A stricter notion of positive association, Rosenbaum’s (1984) conditional (positive) association, is enough to imply PRDS: $\mathbf{X}$ is conditionally associated, if for any partition $(\mathbf{X}_1, \mathbf{X}_2)$ of $\mathbf{X}$, and any function $h(\mathbf{X}_1)$, $\mathbf{X}_2$ given $h(\mathbf{X}_1)$ is positively associated. It is important to note that all of the above properties, including PRDS, remain invariant to taking comonotone transformations in each of the coordinates [Eaton (1986)]. $$\ldots$$ Background on these concepts is clearly presented in Eaton (1986), supplemented by Holland and Rosenbaum (1986).

$\endgroup$
1
$\begingroup$

Positive dependence in this case means that the set of tests are positively correlated. The idea then is that if the variables in the set of tests that you have P-values for are positively correlated then each of the variables are not independent.

If you think back about a Bonferroni p-value correction, for example, you can guarantee that the type 1 error rate is less than 10% over say 100 statistically independent tests by setting your significance threshold to 0.1/100 = 0.001. But, what if each of those 100 tests a correlated in some way? Then you haven't really performed 100 separate tests.

In FDR, the idea is slightly different than the Bonferroni correction. The idea is to guarantee that only a certain percent (say 10%) of the things you declare significant are falsely declared significant. If you have correlated markers (positive dependence) in your dataset, the FDR value is chosen based on the total number of tests you perform (but the actual number of statistically independent tests is smaller). In this way it is more safe to conclude that the false discovery rate is falsely declaring significant 10% or less of the tests in your set of P-values.

Please see this book chapter for a discussion of positive dependence.

$\endgroup$
2
  • 2
    $\begingroup$ You explain FDR vs. Bonferroni, but don't define "positive dependency" but rather just reword it to "positively correlated" but I don't understand. Consider that I have 1000 P values, testing expression of 1000 different genes comparing people with and without some disease. I use the BH method to decide which of these comparisons are "discoveries". What does "positive dependency" mean in this context? $\endgroup$ Commented Aug 22, 2014 at 13:58
  • 6
    $\begingroup$ This answer is flat out wrong. Positive Regression Dependency and being positively associated are different from one another. The Benjamini Yekutieli paper explains this and provides references too. "Nevertheless, PRDS and positive association do not imply one another, and the difference is of some importance. For example, a multivariate normal distribution is positively associated iff all correlations are nonnegative. Not all correlations need be nonnegative for the PRDS property to hold (see Section 3.1, Case 1 below)." See pg. 6 of the paper. $\endgroup$
    – user3303
    Commented Apr 8, 2016 at 7:32

Your Answer

By clicking “Post Your Answer”, you agree to our terms of service and acknowledge you have read our privacy policy.

Not the answer you're looking for? Browse other questions tagged or ask your own question.