1
$\begingroup$

I am trying to create a decision-tree out of a number of attributes, where there are only two final classes and the classes are highly unbalanced (Class 1: 95.5%; Class 2: 4.5%).

The idea is to profile the members of Class 2. For example, Class 2 members have attribute 1 >= 8, attribute 2 < 6, attribute 3 between 1/1/2013 and 12/31/2013.

A profile would be successful if:

  1. it is easily understandable by the business
  2. it shows an improvement in predicting Class 2 over the trivial classifier; i.e.: those classified using the profile should have a > 4.5% probability of actually being in Class 2.

Using WEKA's J48 algorithm along with its CostSensitiveClassifier on one attribute alone (treading carefully here) gives me the following tree: enter image description here
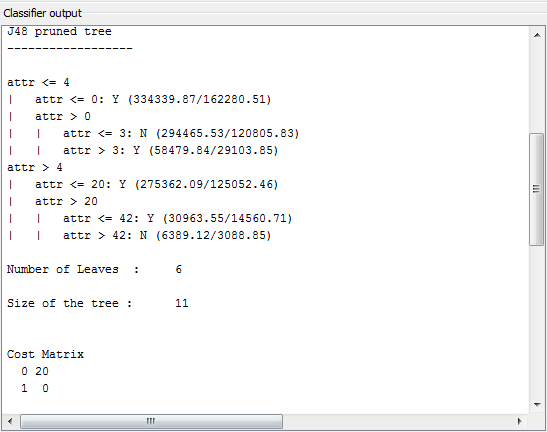
Accuracy is 36.615%, which I can live with. 75% of Class 2 records were correctly classified, which is great. Most importantly, those classified as Class 2 had a 5.4% chance of actually being in Class 2, which meets goal (2) above.

Here's the problem: that tree is awfully complicated for just one attribute.

I am ideally looking for a single rule of the type: attr >= x: Y; attr < x: N.

I have tried many different weights in the cost matrix.

My questions are:

  • What techniques (different algorithms; different options in J48) can I try to obtain a simpler tree?
  • Perhaps the data just doesn't admit a simpler tree. Can people speak of their experiences interpreting complex trees for non-technical audiences?

I am really new to data mining, so if I've missed relevant information or asked the wrong question, please do let me know and I will correct.

Thanks in advance!

$\endgroup$

1 Answer 1

2
$\begingroup$
  1. Trees aren't great classifiers, so you might not get great results with this approach. The improvement with the classifier doesn't seem that good.
  2. I don't use WEKA, but you can usually set the complexity of the tree fairly easily and reduce it to the number of branches/leaves desired. Sometimes this can be done crudely, by increasing the minimum number of observations in each leaf.
  3. You can change the tree into another graphical representation. With two predictors people sometimes create a grid with blue and red squares for yes/no. With a single predictor you can similarly color a line to indicate yes/no.
$\endgroup$
2
  • $\begingroup$ Thanks for your answers! I chose decision trees because they are (theoretically) easy to understand. Do you have any recommendations for classifiers that will do better and still be easy to interpret? $\endgroup$
    – SQLCurious
    Commented Aug 16, 2014 at 3:38
  • $\begingroup$ Don't have any better recommendations. Would consider trying a more complex classifier (logistic or RF) to quantify loss in prediction from using a tree. May not be much, may just be a difficult problem. Depends on your situation, but can sometimes turn a model into simple graphic representation. Point systems, nomograms, and above mentioned grids (for 2 variables) have been used to make models easier to use (?interpretable). $\endgroup$
    – charles
    Commented Aug 16, 2014 at 4:13

Your Answer

By clicking “Post Your Answer”, you agree to our terms of service and acknowledge you have read our privacy policy.

Not the answer you're looking for? Browse other questions tagged or ask your own question.