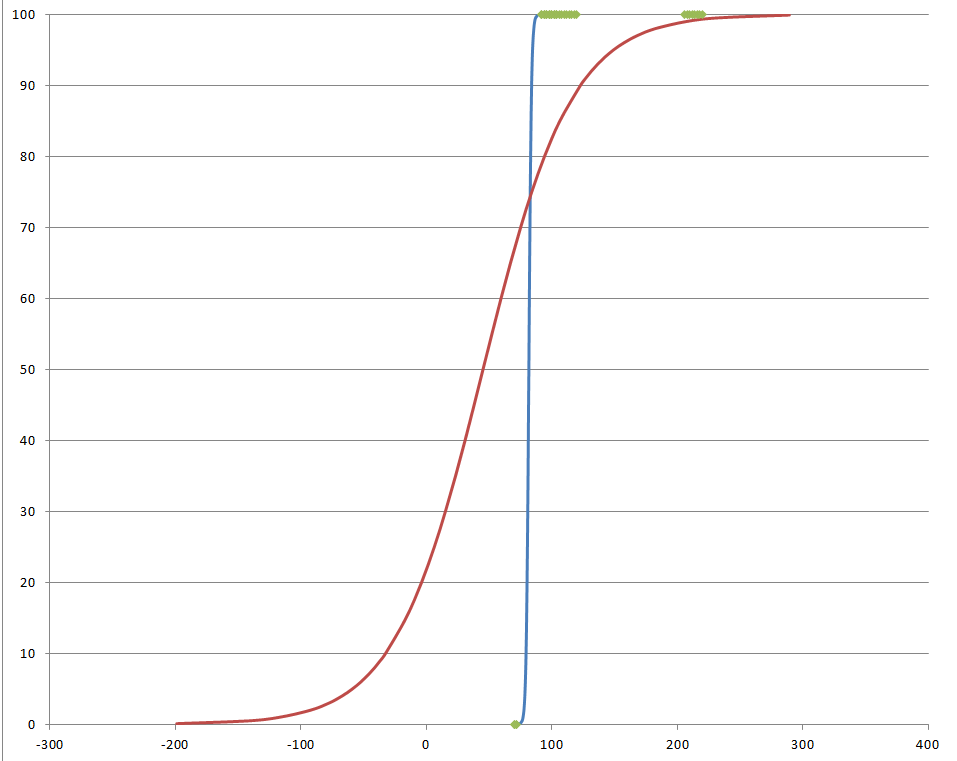
My data is simple, my independant variable is continous from 0-1000 and the response is either a 1 or a 0. I'm performing a logistic regression to determine the 50% inflection point.
When I put this data into Statgraphics 5.1 I get a different respose from my collegaue who is using Statgraphics XVI (my organization is very behind on its software purchases). Is there a reason why these two software versions should give a different response when fed the exact same variables?
Quick excel plot of the two models, and the green dots are the data

