4
$\begingroup$

My data is simple, my independant variable is continous from 0-1000 and the response is either a 1 or a 0. I'm performing a logistic regression to determine the 50% inflection point.

When I put this data into Statgraphics 5.1 I get a different respose from my collegaue who is using Statgraphics XVI (my organization is very behind on its software purchases). Is there a reason why these two software versions should give a different response when fed the exact same variables?

Quick excel plot of the two models, and the green dots are the data
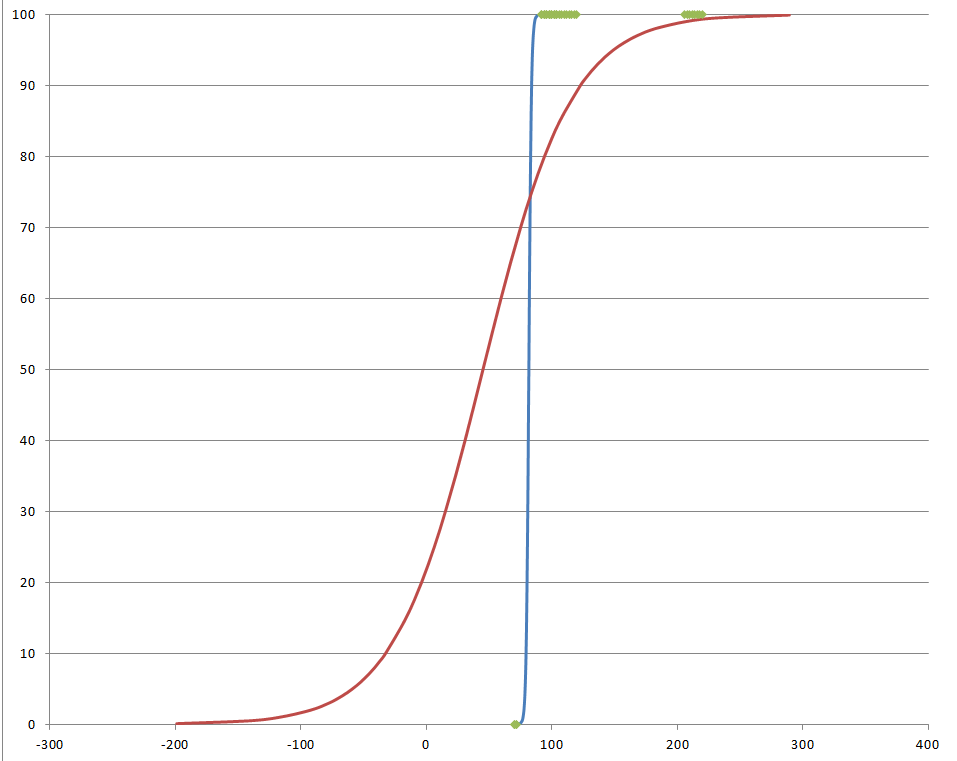
enter image description here

$\endgroup$
6
  • 1
    $\begingroup$ Weclome! I'm afraid this question is not really answerable, unless we can read the source (and we can't), so only the programmers know for sure. All answers must therefore be guesswork and I vote to close the question, sorry. Also, better use R. $\endgroup$
    – Momo
    Commented Sep 10, 2014 at 21:53
  • 2
    $\begingroup$ Are all of your class 0 observations at x~=75? $\endgroup$
    – Sycorax
    Commented Sep 10, 2014 at 22:40
  • $\begingroup$ There can be issues moving data back and forth from Excel to other software. To confirm that both versions are actually analyzing the same dataset, have you also plotted the data using the two versions of StatGraphics which performed the analyses? $\endgroup$
    – whuber
    Commented Sep 10, 2014 at 22:51
  • $\begingroup$ @user777 yes, approximately $\endgroup$
    – Zaralynda
    Commented Sep 11, 2014 at 2:16
  • $\begingroup$ @whuber yes, I've plotted the data in StatGraphics and the data points look correct. $\endgroup$
    – Zaralynda
    Commented Sep 11, 2014 at 2:17

3 Answers 3

7
$\begingroup$

It looks like perfect separation. It means there is a threshold $x_0$ of your covariate $X$ such that $Y = 0$ for $X < x_0$ and $Y = 1$ for $X > x_0$ (or vice-versa).

In that case, the loglikelihood function is not defined, and the result is very package-dependent. See this thread for more information. As a quick check, try flipping the value of $Y$ that corresponds to the highest (or lowest) value of $X$ and see if the results become consistent.

$\endgroup$
6
  • $\begingroup$ This seems likely! I'll check in the morning using your suggestions of flipping one of the Y's and update! $\endgroup$
    – Zaralynda
    Commented Sep 11, 2014 at 2:18
  • 1
    $\begingroup$ Slight correction: the likelihood function is not not defined (given parameters, the probability of each data point is defined and the total likelihood is just the product of them, so no problem). Instead, the issue is that the likelihood does not have a maximum point. $\endgroup$ Commented Sep 11, 2014 at 11:00
  • $\begingroup$ The log-likelihood is not defined because it implies taking a log of zero. $\endgroup$
    – James
    Commented Sep 11, 2014 at 14:13
  • 2
    $\begingroup$ On the contrary, the log likelihood function is perfectly well defined for all finite values of the parameters, even with perfect separation. The difficulty here may be mainly a matter of clarifying one's meaning: I think you may be trying to refer to the value of the log likelihood at the optimal parameter values. Since there are no optimal parameter values in a case of perfect separation--as @Juho points out--a numerical search algorithm can run into problems. $\endgroup$
    – whuber
    Commented Sep 11, 2014 at 14:13
  • $\begingroup$ Flipping the largest X from a 1 to a 0 caused both software packages to give the same result. I'm still trying to understand how seperation affects the likelihood function, but at least I now understand why this data set provided different results and can check our other data for seperation. Thanks! $\endgroup$
    – Zaralynda
    Commented Sep 12, 2014 at 15:31
5
$\begingroup$

This looks like a regularisation issue. The blue line has no regularisation, whereas the red line does. Look for say l2 regularisation in the parameters of the fit... or upload the parameter descriptions. Maybe they have changed the default regularisation parameter

$\endgroup$
3
$\begingroup$

How different are the results?

Remember, the logit model cannot be solved analytically, so it has to be fitted by maximum likelihood estimation by some algorithm, such as those explained in this paper. If this algorithm changed between softwares, it may explain some of the deviance.

$\endgroup$
6
  • $\begingroup$ @Zaralynda there seems to be something fundamentally wrong with the blue model. Not sure what this could be though. $\endgroup$
    – abaumann
    Commented Sep 10, 2014 at 20:09
  • $\begingroup$ the blue model is from the newer software package. I can't figure out from the help files which algorithm they're using, either. Can a different algorithm really explain this much variation? $\endgroup$
    – Zaralynda
    Commented Sep 10, 2014 at 20:16
  • $\begingroup$ No, I suspect a data error of some form. Have you tried manually inspecting your data set in the newer package? $\endgroup$
    – abaumann
    Commented Sep 10, 2014 at 20:18
  • $\begingroup$ Yes, it's only 34 data points, so pretty easy to visually verify that it's the exact same data. Also checked that columns are set for numeric data and such. $\endgroup$
    – Zaralynda
    Commented Sep 10, 2014 at 20:21
  • 2
    $\begingroup$ Assuming the green data are correct, the blue model is the right one and the red one is completely off. $\endgroup$
    – whuber
    Commented Sep 11, 2014 at 2:55

Your Answer

By clicking “Post Your Answer”, you agree to our terms of service and acknowledge you have read our privacy policy.

Not the answer you're looking for? Browse other questions tagged or ask your own question.