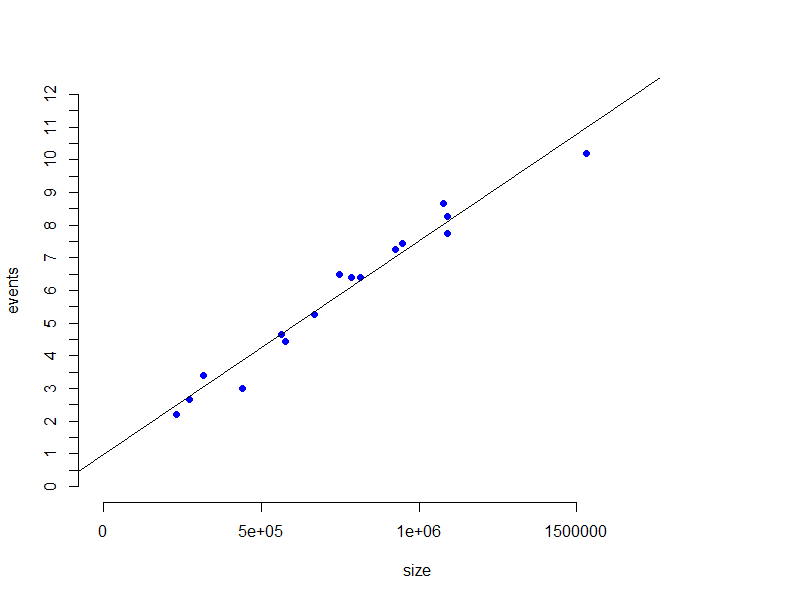
I have done a linear regression in R, using glm function. The calculated intercept says 0.98, but when I plot it, it does not seem to hit the estimated intercept on Y axis. Its far below. Here are my data and function:
event = c(2.2, 6.4, 3.4, 10.2, 4.45, 2.65, 8.25, 4.65, 3, 6.5, 5.25,
8.65, 7.25, 6.4, 7.75, 7.45)

c(230208, 813178, 316617, 1531919, 576869, 270148, 1090947, 562643,
439885, 745741, 666454, 1078175, 924429, 784333, 1091289, 948062)

fit=glm(event~size)

Call:  glm(formula = chr.co.count.wt ~ size)

Coefficients:
(Intercept)         size
  9.783e-01    6.528e-06

Degrees of Freedom: 15 Total (i.e. Null);  14 Residual
Null Deviance:      83.08
Residual Deviance: 2.849    AIC: 23.8


plot(size,events,col="blue",pch=16,xlab="size",ylab="events",ylim=c(0,12),frame.plot=FALSE,xlim=c(0,2000000),axes = F)

axis(side = 1,at = c(0,0.5e6,1e6,1.5e6),labels =  c(0,0.5e6,1e6,1.5e6))
axis(side = 2,at = seq(from = 0,to = 12,by = 0.5),labels = seq(from = 0,to = 12,by = 0.5))
abline(fit.wt)

Why is this discrepancy ? Am i missing something here ? I have also checked the std. err which is 0.27, still higher than what is being observed on plot.
Thank you.
