13
$\begingroup$

The ratio of two independent normal distributions give a Cauchy distribution. The t-distribution is a normal distribution divided by an independent chi-squared distribution. The ratio of two independent chi-squared distribution gives an F-distribution.

I am looking for a ratio of independent continuous distributions that gives a normally distributed random variable with mean $\mu$ and variance $\sigma^2$?

There is probably an infinite set of possible answers. Can you give me some of these possible answers? I would particularly appreciate if the two independent distributions which ratio is computed are the same or at least have similar variance.

$\endgroup$
9
  • 2
    $\begingroup$ While the Wikipedia article on ratio disributions does not provide examples of the case for which you seek, it is an interesting read. $\endgroup$
    – Avraham
    Commented Oct 28, 2014 at 17:27
  • 2
    $\begingroup$ A rather special case is $X$ a standard normal, and $Y$ independently $\pm1$ each with probability $\frac12$, then $X$, $Y$ and $\frac{X}{Y}$ have the same mean and variance and $\frac{X}{Y}$ is normally distributed. $\endgroup$
    – Henry
    Commented Oct 29, 2014 at 21:40
  • 1
    $\begingroup$ "The ratio of two independent chi-squared distribution gives a F-distribution" --- well, not quite. It gives a beta-prime distribution. To get an F you need to scale each chi-square by its df. $\endgroup$
    – Glen_b
    Commented Oct 30, 2014 at 1:12
  • 2
    $\begingroup$ A number of things make me not at all convinced that it is necessarily possible to fulfill all your conditions. $\endgroup$
    – Glen_b
    Commented Oct 30, 2014 at 1:19
  • 1
    $\begingroup$ taking the generation of normal variables method (e.g Box-Muller) as example (which uses the circle method) i would say there are no ratios of uniform distributions that give a normal distribution (assuming uniform distributions are asked for) $\endgroup$
    – Nikos M.
    Commented Oct 31, 2014 at 7:04

3 Answers 3

7
$\begingroup$

Let $Y_1 = Z \sqrt{E}$ where $E$ has an exponential distribution with mean $2 \sigma^2$ and $Z = \pm 1$ with equal probability. Let $Y_2 = 1 / \sqrt{B}$ where $B \sim \mbox{Beta}(0.5, 0.5)$. Assuming $(Z, E, B)$ are mutually independent, then $Y_1$ is independent of $Y_2$ and $Y_1 / Y_2 \sim \text{Normal}(0, \sigma^2)$. Hence we have

  1. $Y_1$ independent of $Y_2$;
  2. Both continuous; such that
  3. $Y_1 / Y_2 \sim \text{Normal}(0, \sigma^2)$.

I haven't figured out how to get a $\text{Normal}(\mu, \sigma^2)$. It is harder to see how to do this since the problem reduces to finding $A$ and $B$ which are independent such that $$ \frac{A - B \mu}{B} \sim \text{Normal}(0, 1) $$ which is quite a bit harder than making $A/B \sim \text{Normal}(0,1)$ for independent $A$ and $B$.

$\endgroup$
3
  • 2
    $\begingroup$ If this is true, this is awesome. $\endgroup$
    – Neil G
    Commented Jun 9, 2018 at 4:02
  • 2
    $\begingroup$ @NeilG it is true; the product of my beta and exponential is a gamma with shape 1/2 (because of how you can build the beta and an independent gamma using gammas). Then the square root of that is half-normal using the fact that the square of a normal is chi-square. $\endgroup$
    – guy
    Commented Jun 9, 2018 at 15:22
  • 1
    $\begingroup$ We had recently a question asking for a product of two variables that is normal distributed (I can not find it back). That question had a comment or answer relating to the Box-Muller transform which computes a normal distribution (or more precisely a bivariate normal distribution) from the product of two transformed uniform distributed variables. This answer relates a lot to that but takes the inverse of one of those variables in the Box-Muller transform. cc: @kjetilbhalvorsen $\endgroup$ Commented Jul 27, 2019 at 23:30
4
$\begingroup$

I would particularly appreciate if the two independent distributions which ratio is computed are the same 

There is no possibility that a normal variable can be written as a ratio of two independent variables with the same distribution or distribution family (such as the F-distribution which is the ratio of two scaled $\chi^2$ distributed variables or the Cauchy-distribution which is the ratio of two normal distributed variables with zero mean).

  • Suppose that: for any $A, B \sim F$ where $F$ is the same distribution or distribution family we have $$X = \frac{A}{B} \sim N(\mu,\sigma^2)$$

  • We must also be able to reverse $A$ and $B$ (if a normal variable can be written as a ratio of two independent variables with the same distribution or distribution family then the order can be reversed) $$\frac{1}{X} = \frac{B}{A} \sim N(\mu,\sigma^2)$$

  • But if $X \sim N(\mu,\sigma^2)$ then $X^{-1} \sim N(\mu,\sigma^2)$ can not be true (the inverse of a normal distributed variable is not another normal distributed variable).

Broader conclusion: If the variables in any distribution family $\mathcal{F}_X$ can be written as a ratio of variables in another distribution family $\mathcal{F}_Y$ then it must be that family $\mathcal{F}_X$ is closed under taking the reciprocal (ie. for any variable whose distribution is in $\mathcal{F}_X$ the distribution of it's reciprocal will also be in $\mathcal{F}_X$).

E.g. the inverse of a Cauchy distributed variable is also Cauchy distributed. The inverse of an F-distributed variable is also F-distributed.

  • This 'if' is not an 'iff', the converse is not true. When $X$ and $1/X$ are in the same distribution family then it may not always be possible to be written as a ratio distribution with nominator and denominator from the same distribution family.

    Counterexample: We can imagine distribution families for which for any $X$ in the family we have $1/X$ in the same family but we do not have $P(X=1)=0$. This is contradicting with the fact that for a ratio distribution where the denominator and nominator have the same distribution we must have $P(X=1) \neq 0$ (and something similar can be expressed for continuous distributions like the integral along the line X/Y=1 in a scatterplot of X,Y has some non zero density when X and Y have the same distribution and are independent).

$\endgroup$
13
  • $\begingroup$ Don't see it. Seems to me that just because $A/D$ and $B/C$ are normal that does not make $\frac{A/D}{B/C}$ normal. $\endgroup$
    – Carl
    Commented Jun 9, 2018 at 0:57
  • $\begingroup$ Better. Now it makes sense. $\endgroup$
    – Carl
    Commented Jun 9, 2018 at 1:07
  • 1
    $\begingroup$ I don't understand how the second statement follows from the first. If there exists some $A, B$ such that their quotient is normal, why does it follow that their quotient in the other order should also be normal? The question didn't ask for a distribution family such that the quotient of all pairs of elements is normal. $\endgroup$
    – Neil G
    Commented Jun 9, 2018 at 4:00
  • 1
    $\begingroup$ I don't understand what you're saying. Ideally, your answer would be a coherent argument without requiring someone to read the edits. Right now, it seems like your second statement ("we must also have") doesn't follow from the first. $\endgroup$
    – Neil G
    Commented Jun 9, 2018 at 8:11
  • 2
    $\begingroup$ +1: Straightforward, clear, elegant, and insightful. $\endgroup$
    – whuber
    Commented Jul 26, 2019 at 13:00
-1
$\begingroup$

Well, here is one but I will not prove it, only show it in simulation.

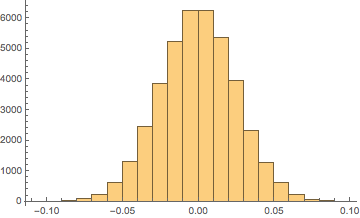
Make two beta distributions with equal large shape parameters $\text{Beta}(200,200)$ (here, $n=40,000$), subtract 1/2 from the $x$-values of one of them and call it "numerator." That gives us a PDF that has a maximum range of $\left(-\frac{1}{2},\,\frac{1}{2}\right)$, but because the shape parameters are so large, we never get to the maximum values of the range. Here is a histogram of an $n=40,000$ "numerator" enter image description here
Next, we call the second beta distribution "denominator" without subtracting anything, so it has the usual beta distribution range of $(0,1)$ and one of those looks like this
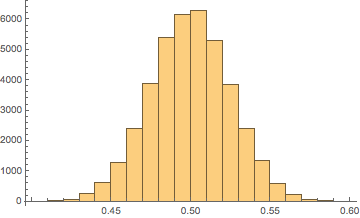
enter image description here

Again, because the shapes are so large, we do not approach the maximum range with the values. Next we plot the quotient $\frac{\text{numerator}}{\text{denominator}}$ as a PDF with the superimposed normal distribution.
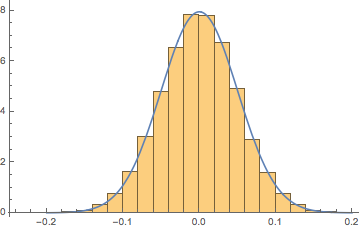
enter image description here

Now in this case the normal distribution result has $\mu \to -0.0000204825,\sigma \to 0.0501789$ and tests for normality that look like this

$$\left( \begin{array}{ccc} \text{} & \text{Statistic} & \text{P-Value} \\ \text{Anderson-Darling} & 0.799786 & 0.481181 \\ \text{Baringhaus-Henze} & 1.40585 & 0.0852017 \\ \text{Cramér-von Mises} & 0.123145 & 0.482844 \\ \text{Jarque-Bera ALM} & 4.48103 & 0.106404 \\ \text{Kolmogorov-Smirnov} & 0.00452328 & 0.386335 \\ \text{Kuiper} & 0.00798063 & 0.109127 \\ \text{Mardia Combined} & 4.48103 & 0.106404 \\ \text{Mardia Kurtosis} & 1.53849 & 0.123929 \\ \text{Mardia Skewness} & 2.09399 & 0.147879 \\ \text{Pearson }\chi ^2 & 134.353 & 0.571925 \\ \text{Watson }U^2 & 0.113831 & 0.211187 \\ \end{array} \right)$$

In other words, we cannot prove the ratio is not normal even trying very hard to do so.

Now why? Intuition on my part, which I have in overabundance. Proof left to reader, if any exists (maybe via limit of method of moments, but again that is just intuition).

Hint: If I use only $\text{Beta}(20,20)$ in denominator and $\text{Beta}(20,20)-\frac{1}{2}$ in the numerator and I get Student's $t$ with $\mu \to -0.000251208,\sigma \to 0.157665,\text{df}\to 33.0402$
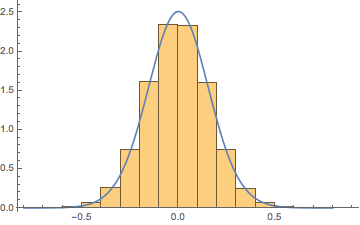
enter image description here

$$\begin{array}{l|ll} \text{} & \text{Statistic} & \text{P-Value} \\ \hline \text{Anderson-Darling} & 0.275262 & 0.955502 \\ \text{Cramér-von Mises} & 0.0351108 & 0.956524 \\ \text{Kolmogorov-Smirnov} & 0.00320936 & 0.804486 \\ \text{Kuiper} & 0.00556501 & 0.657146 \\ \text{Pearson }\chi ^2 & 145.077 & 0.323168 \\ \text{Watson }U^2 & 0.0351042 & 0.878202 \\ \end{array}$$

Another hint $\dfrac{\mathcal{N}(0,1)}{\mathcal{N}(10,1/1000)}\to$ Student's $t$ $\mu \to -0.0000535722,\sigma \to 0.0992765,\text{df}\to 244.154$
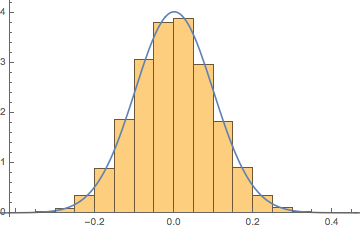
enter image description here

$$\left( \begin{array}{ccc} \text{} & \text{Statistic} & \text{P-Value} \\ \text{Anderson-Darling} & 0.501677 & 0.745102 \\ \text{Cramér-von Mises} & 0.0696824 & 0.753515 \\ \text{Kolmogorov-Smirnov} & 0.00355688 & 0.692225 \\ \text{Kuiper} & 0.00608382 & 0.501133 \\ \text{Pearson }\chi ^2 & 142.88 & 0.370552 \\ \text{Watson }U^2 & 0.0603207 & 0.590369 \\ \end{array} \right)$$

Edit "Under certain conditions a normal approximation is possible" See link. Moreover, the main text of that Wikipedia article shows interesting material on the ratio distribution topic. Another reference.

$\endgroup$
13
  • 6
    $\begingroup$ You are clearly very close to a normal distribution. However, that isn't at all the same thing as having a normal distribution, and I don't believe the ratio of a centered symmetric beta to an ordinary symmetric beta with the same parameters is ever to be actually normal. I'd be very interested in being wrong about this though. $\endgroup$
    – Glen_b
    Commented Jun 9, 2018 at 2:24
  • 4
    $\begingroup$ Your solution definitely is not Normal. You could generalize this approach: take any distribution that is approximately Normal and divide it by a distribution with its probability concentrated near a nonzero number. The result (obviously) will be close to Normal--but it still will not be Normal. Applying a bunch of tests is unconvincing because all it shows it that you didn't generate sufficiently large samples to demonstrate the non-Normality. $\endgroup$
    – whuber
    Commented Jun 9, 2018 at 18:34
  • 1
    $\begingroup$ @whuber At $10^8$ one could also show in normal machine precision that noise will cause anything to be not normal. I do not have a super computer to do that in extended precision. What you could show, and why I wanted you to look at this, was to prove or disprove these things mathematically, not just criticize around the edges with unachievable goals. $\endgroup$
    – Carl
    Commented Jun 11, 2018 at 14:25
  • 2
    $\begingroup$ Let me get to the heart of the matter, then: (1) disproving normality is a simple exercise in integral approximation--no need to give the details here. You can, e.g., readily prove the 200th moment is infinite. (2) Your answer confuses distributions with samples. It is this fundamental confusion that I object to; it's the reason why I think this answer is more misleading than helpful. BTW, I did not write my last comment lightly: I performed that test. I did it not with a supercomputer, but with a decade-old PC workstation, and the whole process took just seconds. $\endgroup$
    – whuber
    Commented Jun 11, 2018 at 14:27
  • 3
    $\begingroup$ @whuber Let me make one final point. I answered here to stimulate interest, which I have done. Without my interest, this conversation, which lay dormant since 2014, would still be unanswered. I see my role as stimulating thought, not as being pluperfect or walking on water. $\endgroup$
    – Carl
    Commented Jun 11, 2018 at 16:41

Your Answer

By clicking “Post Your Answer”, you agree to our terms of service and acknowledge you have read our privacy policy.

Not the answer you're looking for? Browse other questions tagged or ask your own question.