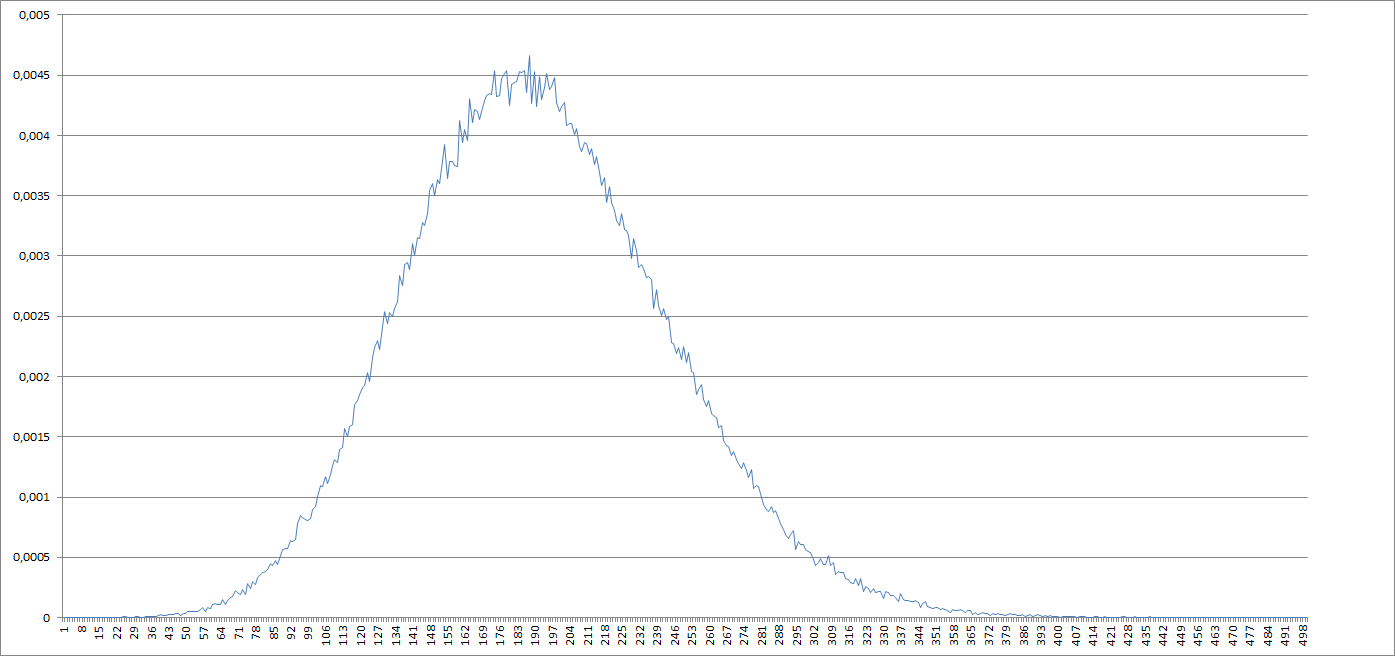
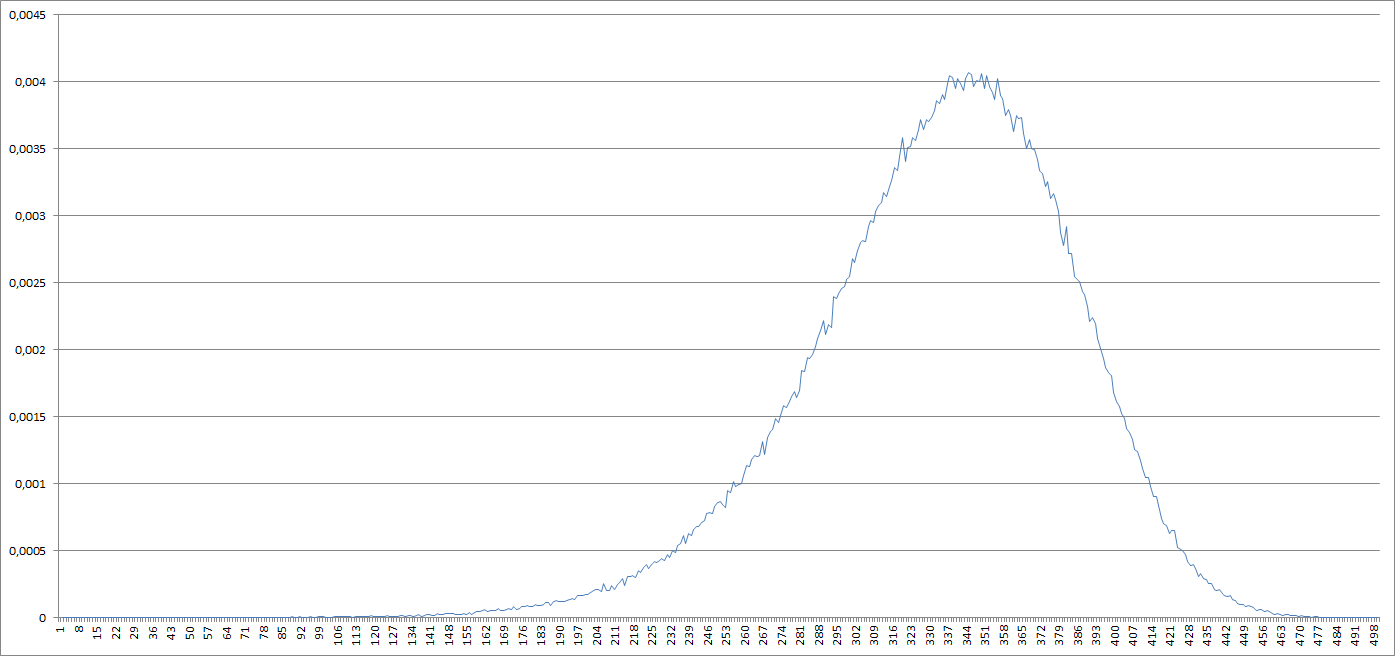
I have made several experiments, the result graphs are below, I need to figure out what is the distribution function of the following random variables... Where do I start with statistical analysis of my experiment?
How to perform these analysis with spss?


EDIT Explanations: I'm testing algorithm efficiency for 2 algorithms, the graphs describe efficiency distribution.
I made 500000 tests for 2 algorithms, which produced 2 sets of 500000 floating point values.
I've computed MIN and MAX value of the set (The smaller the values the better the result is, the bigger the values the worser the result is)
I wanted to see the distribution of values according to 500 groups, so I've computed step = (MAX-MIN) / 500
I've computed the amount of values that fall into each of 500 segments
[MIN + 0 * Step..MIN + 1 * Step],
[MIN + 1 * Step, MIN + 2 * Step], ...
[MIN + 498 * Step..MIN + 499 * Step]
The graph you see below represents on x-axis an index of the segment, on y-axis the amount values fallen into the segment divided by the total number of values, and also divided by the Step = (Max - Min) / 500. As a result this should represent the distribution function of my algorithm efficiency...
EDIT Here is DOC containing SPSS > Analyze > Descriptive Statistics > Explore output. Can anybody help reading that?
