3
$\begingroup$

Suppose I fit a linear regression to some data (say, weight vs. height), and all the standard linear regression assumptions are satisfied (in particular, the data is homoscedastic). For example, here's a random figure pulled from amstat.org that looks like it satisfies what I'm thinking of:
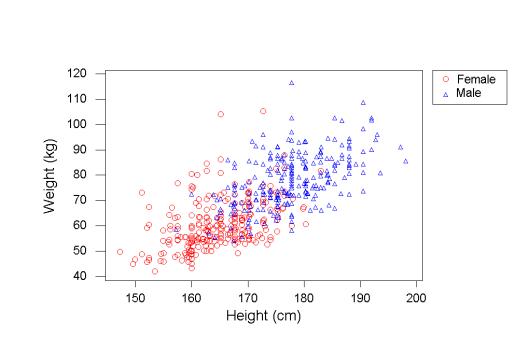
enter image description here

Now I'm doing some exploratory data analysis, so I want to look at examples where the linear regression is particularly off; that is, I want to sort all the individuals by how badly the regression predicts their weight from their height (so that, say, I can look at further details, like whether people whose weight the model underpredicts tend to eat a lot of junk food). My question is:

  • Should I sort all the individuals by their raw residuals?
  • Or should I sort all the individuals by the residuals as a percentage of the prediction, i.e., by residual weight / predicted weight?

On the one hand, it seems like sorting by raw residuals might be the way to go, since standard linear regression errors are based off the squared residuals, and not the residual percentages. On the other hand, someone who weighs 70kg when their predicted weight is 50kg seems much more of an outlier than someone who weighs 120kg when their predicted weight is 100kg.

Is it just a matter of preference or the particular model at hand?

$\endgroup$
7
  • $\begingroup$ Just out of curiousity, do the two methods lead to a much different ordering? $\endgroup$ Commented Jul 18, 2011 at 6:22
  • $\begingroup$ Do you have a rough noise model, e.g. $\sigma(x)$ increasing with x, with scaled residuals $(\frac{y - ax}{\sigma(x)})^2$ roughly flat ? $\endgroup$
    – denis
    Commented Jul 18, 2011 at 8:41
  • $\begingroup$ Ratios are indeed better indicators than absolute differences in this case @dominic yes there should be a different ordering, since in mentioned example both residuals are 20, but relative errors are $2/7 > 2/12$. @raegtin it seems you just want to define what are the outliers in the regression model, isn't it? $\endgroup$ Commented Jul 18, 2011 at 11:40
  • $\begingroup$ @Denis: I'm assuming that $\sigma(x)$ is constant. @Dmitrij: yep, I basically just want to find the outliers. From a "minimize sum of squares" point of view, it seems like I shouldn't be scaling residuals to find outliers, but intuitively it seems like I should. @dominic: yep, like Dmitrij said, the two methods should lead to a much different ordering (especially if there's a large range in the x-axis). $\endgroup$
    – raegtin
    Commented Jul 18, 2011 at 20:14
  • 1
    $\begingroup$ Maybe part of the problem is that I'm surprised many models seem to have constant variance. For example, I'm surprised in the example above that there's not a larger variance in weight as height increases. $\endgroup$
    – raegtin
    Commented Jul 18, 2011 at 20:17

1 Answer 1

3
$\begingroup$

I would consider normalizing the residual by the Prediction Interval and then proceeding to sort your residuals. A prediction interval is the estimate of an interval in which observations will fall within a certain probability given what is observed. (This is in contrast to a confidence interval which is typically associated which the parameters of your model.). The farther the value of the predicted X from X-bar the higher the prediction interval error so this makes for an ideal "residual scaling factor".

To be a bit more specific, for each prediction you can define the standard error of the estimate associated with the prediction interval. Then you can calculate a t-statistic associated with the observed value with respect to the standard error of the prediction interval. Sort by the absolute value of the t-statistic to see which predictions are most anomalous.

$\endgroup$
2
  • 1
    $\begingroup$ Great suggestion! However, isn't the standard error of the prediction interval minimized at the mean of the x-range, and then monotonically and symmetrically increasing on the other sides? (That is, I do like this t-statistic approach, but if I remember the standard error calculation correctly, this particular t-stat seems a bit "artificial" in a sense -- why should I consider residuals at the mean of my x-range to be more outlier-y than residuals at the extremes?) $\endgroup$
    – raegtin
    Commented Jul 19, 2011 at 19:22
  • $\begingroup$ Correct - the standard error is minimized at the mean and symmetrically on both sides. I suggest sorting on the absolute value of the t-statistic to address that symmetry. You need a ruler to compare which residuals are more "outlier-y". The magnitude of the residual is not a good measure because it depends on its proximity to the mean. So I suggest normalizing the absolute residual with respect to the prediction interval so you can compare across residuals. If the residual is large but farther from the mean then this approach will proportionally give that residual more tolerance for error. $\endgroup$ Commented Jul 19, 2011 at 22:30

Your Answer

By clicking “Post Your Answer”, you agree to our terms of service and acknowledge you have read our privacy policy.

Not the answer you're looking for? Browse other questions tagged or ask your own question.