24
$\begingroup$

I was reading the following justification (from cs229 course notes) on why we divide the raw data by its standard deviate:
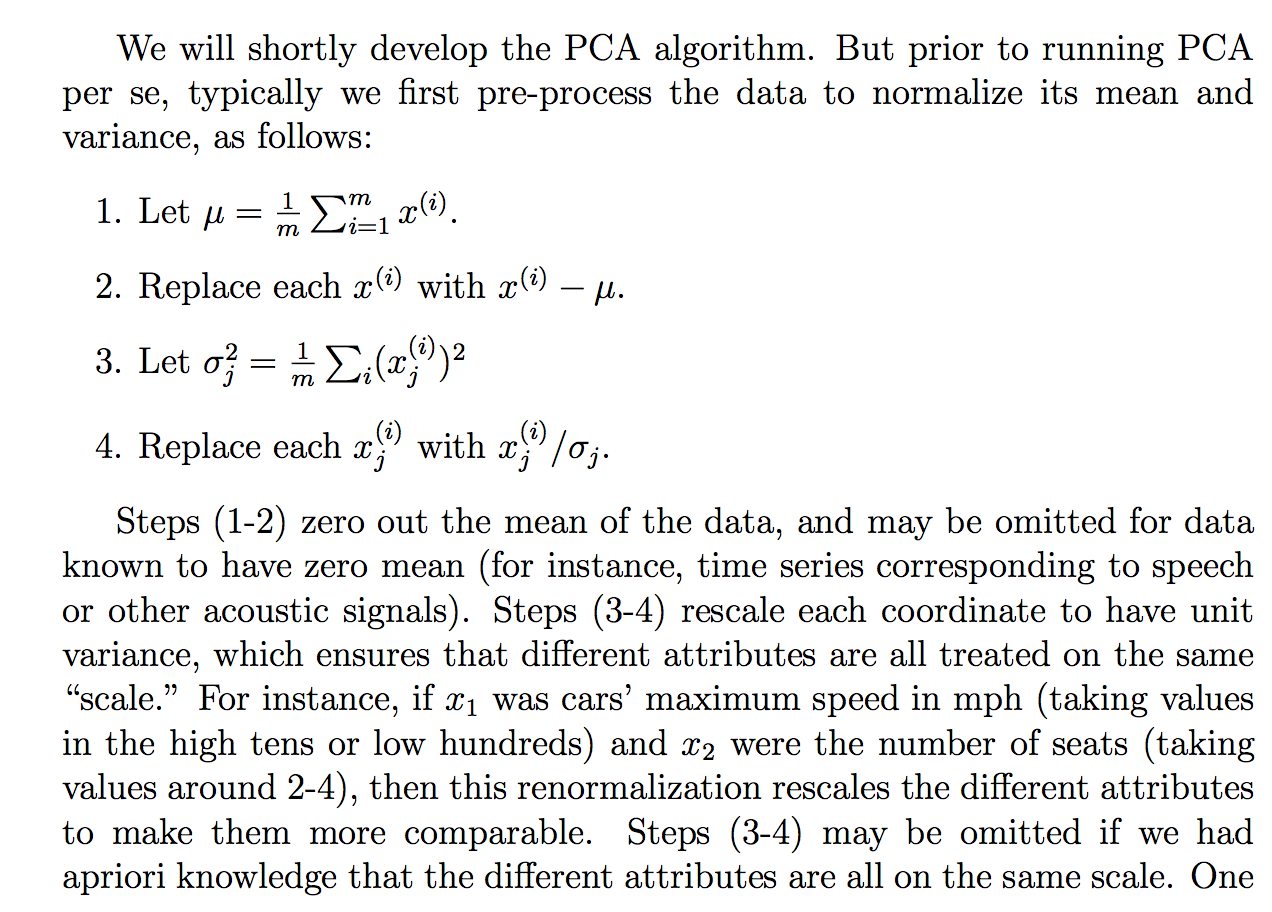
enter image description here

even though I understand what the explanation is saying, it is not clear to me why dividing by the standard deviation would achieve such a goal. It says so that everyone is more on the same "scale". However, its not entirely clear why dividing by the standard deviation achieves that. Like, whats wrong with dividing by the variance? Why not some other quantity? Like...the sum of absolute values? or some other norm... Is there a mathematical justification for choose the STD?

Are the claims in this extract a theoretical statement that can be derived/proved through mathematics (and/or statistics) or is it more one of those statement that we do because it seems to work in "practice"?

Basically, can one provide either a rigorous mathematical explanation of why that intuition is true? Or if its just an empirical observation, why we think that works in general before doing PCA?

Also, in the context of PCA, is this the process of standardizing or normalizing?


Some other thoughts I had that might "explain" why the STD:

Since PCA can be derived from maximizing the variance, I guessed that dividing by a related quantity such as the STD, might be one of the reasons we divided by the STD. But then I considered that maybe if we defined maybe a "variance" with any other norm, $\frac{1}{n} \sum^{n}_{i=1} (x_i -\mu)^p$, then we would divide by the STD of that norm (by taking the pth root or something). Though, it was just a guess and I am not 100% about this, hence the question. I was wondering if anyone knew anything related to this.


I did see that there was maybe a related question:

PCA on correlation or covariance?

but it seemed talk more about when to use "correlation" or "covariance" but lacked rigorous or convincing or detailed justifications, which is what I am mainly interested in.

Same for:

Why do we need to normalize data before analysis

related:

"Normalizing" variables for SVD / PCA

$\endgroup$
13
  • 3
    $\begingroup$ There is a mathematical reason - dividing the (centered) data by the SD for each variable produces a transformed data set whose covariance matrix is simply the correlation matrix of the original (centered) data. After that, we're on correlation vs covariance matrix territory again. Are you seeking proof of how normalizing the data turns the covariance matrix into a correlation matrix? $\endgroup$
    – Silverfish
    Commented Jan 19, 2015 at 23:33
  • $\begingroup$ Your title question reads as if you are asking what the purpose of normalizing it (as opposed to not normalizing). This would be a duplicate of "PCA on correlation or covariance". However, what you actually seem to be asking is why normalization is done via dividing by STD (as opposed to dividing by variance, or range, etc.). If so, do you perhaps want to edit to make the title question more precise? $\endgroup$
    – amoeba
    Commented Jan 19, 2015 at 23:35
  • 3
    $\begingroup$ Regarding the terminology, "normalizing" is not a precise term and can refer to various things. Whereas "standardizing" means subtracting the mean and dividing by standard deviation, which is what you are referring to. $\endgroup$
    – amoeba
    Commented Jan 19, 2015 at 23:37
  • 3
    $\begingroup$ I should add that I think your question is very good (+1). One can indeed normalize by dividing by something else; for example, standard deviation is a very non-robust measure and can be misleading in the presence of strong outliers. So one can choose to divide by some robust measure of spread instead (see e.g. "median absolute deviation"). There is no "rigorous mathematical explanation" of why using STD is the best way to normalize, and you are right on the mark that it is "just an empirical observation" that it often works well. $\endgroup$
    – amoeba
    Commented Jan 19, 2015 at 23:55
  • 2
    $\begingroup$ Re "why not divide by variance instead" - that can be fairly easily explained by the dimensional inconsistency. It would give you strange results if you changed the units one of the variables was in, for instance. Re "why not divide by MAD" - if the data were normally distributed, then since (in the population) MAD is proportional to SD, it would be possible to divide by an appropriate multiple of MAD and get an (inefficient but possibly robust?) estimate of the correlation. That's more interesting. $\endgroup$
    – Silverfish
    Commented Jan 20, 2015 at 0:22

3 Answers 3

16
$\begingroup$

This is in partial answer to "it is not clear to me why dividing by the standard deviation would achieve such a goal". In particular, why it puts the transformed (standardized) data on the "same scale". The question hints at deeper issues (what else might have "worked", which is linked to what "worked" might even mean, mathematically?), but it seemed sensible to at least address the more straightforward aspects of why this procedure "works" - that is, achieves the claims made for it in the text.

The entry on row $i$ and column $j$ of a covariance matrix is the covariance between the $i^{th}$ and $j^{th}$ variables. Note that on a diagonal, row $i$ and column $i$, this becomes the covariance between the $i^{th}$ variable and itself - which is just the variance of the $i^{th}$ variable.

Let's call the $i^{th}$ variable $X_i$ and the $j^{th}$ variable $X_j$; I'll assume these are already centered so that they have mean zero. Recall that $$Cov(X_i, X_j) =\sigma_{X_i} \, \sigma_{X_j} \, Cor(X_i, X_j)$$

We can standardize the variables so that they have variance one, simply by dividing by their standard deviations. When standardizing we would generally subtract the mean first, but I already assumed they are centered so we can skip that step. Let $Z_i = \frac{X_i}{\sigma_{X_i}}$ and to see why the variance is one, note that

$$Var(Z_i) = Var\left(\frac{X_i}{\sigma_{X_i}}\right) = \frac{1}{\sigma_{X_i}^2}Var(X_i) = \frac{1}{\sigma_{X_i}^2} \sigma_{X_i}^2 = 1$$

Similarly for $Z_j$. If we take the entry in row $i$ and column $j$ of the covariance matrix for the standardized variables, note that since they are standardized:

$$Cov(Z_i, Z_j) =\sigma_{Z_i} \, \sigma_{Z_j} \, Cor(Z_i, Z_j) = Cor(Z_i, Z_j)$$

Moreover when we rescale variables in this way, addition (equivalently: subtraction) does not change the correlation, while multiplication (equivalently: division) will simply reverse the sign of the correlation if the factor (divisor) is negative. In other words correlation is unchanged by translations or scaling but is reversed by reflection. (Here's a derivation of those correlation properties, as part of an otherwise unrelated answer.) Since we divided by standard deviations, which are positive, we see that $Cor(Z_i, Z_j)$ must equal $Cor(X_i, X_j)$ i.e. the correlation between the original data.

Along the diagonal of the new covariance matrix, note that we get $Cov(Z_i, Z_i) = Var(Z_i) = 1$ so the entire diagonal is filled with ones, as we would expect. It's in this sense that the data are now "on the same scale" - their marginal distributions should look very similar, at least if they were roughly normally distributed to start with, with mean zero and with variance (and standard deviation) one. It is no longer the case that one variable's variability swamps the others. You could have divided by a different measure of spread, of course. The variance would have been a particularly bad choice due to dimensional inconsistency (think about what would have happened if you'd changed the units one of your variables was in, e.g. from metres to kilometres). Something like median absolute deviation (or an appropriate multiple of the MAD if you are trying to use it as a kind of robust estimator of the standard deviation) may have been more appropriate. But it still won't turn that diagonal into a diagonal of ones.

The upshot is that a method that works on the covariance matrix of standardized data, is essentially using the correlation matrix of the original data. For which you'd prefer to use on PCA, see PCA on correlation or covariance?

$\endgroup$
8
  • 2
    $\begingroup$ I think this answer does not really touch on the actual (and non-trivial) question of why standard deviation is taken as a measure of spread and used for normalization. Why not taking median absolute deviation instead? Granted, the resulting covariance matrix will not be the "default" correlation matrix, but perhaps it will be better, e.g. a more robust estimation of the correlation matrix. See also my last comment to the OP. $\endgroup$
    – amoeba
    Commented Jan 19, 2015 at 23:59
  • 2
    $\begingroup$ @ameoba On the "medium deep" point, the fact that we get variances of one down the diagonal of the new covariance matrix is essentially what we mean by getting the transformed data to have variables "on the same scale" from the PCA perspective. On the "very deep" issues raised by this question, I'm not sure there is much difference between asking "well why do we use variances as our measure of scale in PCA?" and asking "why does PCA concern itself with (co)variances?" - or at least, that the two issues would be intimately related. $\endgroup$
    – Silverfish
    Commented Jan 20, 2015 at 0:11
  • 1
    $\begingroup$ @amoeba, why not divide by MAD or by variance instead of SD is, essentially, the same question as why to differentially scale at all: that is, why not to do PCA on covariances instead? I support this idea in the preceding comment. $\endgroup$
    – ttnphns
    Commented Jan 20, 2015 at 0:30
  • 1
    $\begingroup$ @ttnphns: If different variables have completely incomparable scales (temperature, length, weight, etc.), then the desire to somehow normalize the variables is quite understandable. That's the common argument for using correlation matrix instead of covariance matrix. But if somebody is worried about outliers, I see nothing wrong with subtracting the median instead of the mean and dividing by MAD instead of SVD... I never did it myself, but I think it does sound like a reasonable thing to do. $\endgroup$
    – amoeba
    Commented Jan 20, 2015 at 0:43
  • 1
    $\begingroup$ @amoeba, Linear PCA needs the matrix to be the SSCP-type matrix. Any linear transform of the original variables preserves this type. Of course, you could do any nonlinear transform as well (such as, for instance, ranking, to get Spearman rho matrix), but then component scores and loadings loose their direct (in sense of least squares minimization) connection with the data: they now represent the transformed data instead! $\endgroup$
    – ttnphns
    Commented Jan 20, 2015 at 0:59
8
$\begingroup$

Why do we divide by the standard deviation
whats wrong with dividing by the variance?

as @Silverfish already pointed out in a comment, the standard deviation has the same unit as the measurements. Thus, dividing by standard deviation as opposed to variance, you end up with a plain number that tells you where your case is relative to average and spread as measured by mean and standard deviation. This is very close to the idea of $z$-values and the standard normal distribution: If the data are normally distributed, standardization will transform them to a standard normal distribution.

So: standardization (mean centering + scaling by standard deviation) makes sense if you consider the standard normal distribution sensible for your data.

Why not some other quantity? Like...the sum of absolute values? or some other norm...

Other quantities are used to scale data, but the procedure is called standardization only if it uses mean centering and dividing by standard deviation. Scaling is the generic term.

E.g. I work with spectroscopic data and know that my detector has a wavelength-dependent sensitivity and an (electronic) bias. Thus I calibrate by subtracting the offset (blank) signal and multiplying (dividing) by a calibration factor.

Also, I may be centering not to the mean but instead to some other baseline value, such as the mean of a control group instead of the grand mean. (Personally, I almost never standardize as my variates already have the same physical unit and are in the same order of magnitude)

See also: Variables are often adjusted (e.g. standardised) before making a model - when is this a good idea, and when is it a bad one?

$\endgroup$
1
  • 1
    $\begingroup$ +1. Nice example with spectroscopic data. By the way, congratulations with reaching 10k rep! $\endgroup$
    – amoeba
    Commented Feb 7, 2015 at 15:54
0
$\begingroup$

This link answers your question clearly, I guess: http://sebastianraschka.com/Articles/2014_about_feature_scaling.html

I quote a small piece:

Z-score standardization or Min-Max scaling?

“Standardization or Min-Max scaling?” - There is no obvious answer to this question: it really depends on the application.

For example, in clustering analyses, standardization may be especially crucial in order to compare similarities between features based on certain distance measures. Another prominent example is the Principal Component Analysis, where we usually prefer standardization over Min-Max scaling, since we are interested in the components that maximize the variance (depending on the question and if the PCA computes the components via the correlation matrix instead of the covariance matrix; but more about PCA in my previous article).

However, this doesn’t mean that Min-Max scaling is not useful at all! A popular application is image processing, where pixel intensities have to be normalized to fit within a certain range (i.e., 0 to 255 for the RGB color range). Also, typical neural network algorithm require data that on a 0-1 scale.

$\endgroup$

Your Answer

By clicking “Post Your Answer”, you agree to our terms of service and acknowledge you have read our privacy policy.

Not the answer you're looking for? Browse other questions tagged or ask your own question.