47
$\begingroup$

So this is a very simple and basic question. However, when I was in school, I paid very little attention to the whole concept of simulations in class and that's left me a little terrified of that process.

  1. Can you explain the simulation process in laymen terms? (could be for generating data, regression coefficients, etc)

  2. What are some practical situations/problems when one would use simulations?

I would prefer any examples given to be in R.

$\endgroup$
3
  • 10
    $\begingroup$ (2) already has over a thousand answers on this site: search for simulate. $\endgroup$
    – whuber
    Commented Jan 30, 2015 at 14:56
  • $\begingroup$ @Tim The only thing there is to disagree with in my comment is that our site has over a thousand answers containing simulations, but that is an objective fact whose truth you can verify yourself. I made no claim, explicit or implicit, that this represents a complete or representative list of anything. As a set of actual examples, however, it is far richer and more detailed than any individual answer could ever hope to accomplish and as such is a valuable resource for anyone who might wish to pursue question (2) further. $\endgroup$
    – whuber
    Commented Jan 30, 2015 at 20:45
  • $\begingroup$ @whuber ok, good point. $\endgroup$
    – Tim
    Commented Jan 30, 2015 at 20:46

6 Answers 6

46
$\begingroup$

A quantitative model emulates some behavior of the world by (a) representing objects by some of their numerical properties and (b) combining those numbers in a definite way to produce numerical outputs that also represent properties of interest.

Figure 1: a deterministic model

In this schematic, three numerical inputs on the left are combined to produce one numerical output on the right. The number lines indicate possible values of the inputs and output; the dots show specific values in use. Nowadays digital computers usually perform the calculations, but they are not essential: models have been calculated with pencil-and-paper or by building "analog" devices in wood, metal, and electronic circuits.

As an example, perhaps the preceding model sums its three inputs. R code for this model might look like

inputs <- c(-1.3, 1.2, 0) # Specify inputs (three numbers)
output <- sum(inputs)     # Run the model
print(output)             # Display the output (a number)

Its output simply is a number,

-0.1

We cannot know the world perfectly: even if the model happens to work exactly the way the world does, our information is imperfect and things in the world vary. (Stochastic) simulations help us understand how such uncertainty and variation in the model inputs ought to translate into uncertainty and variation in the outputs. They do so by varying the inputs randomly, running the model for each variation, and summarizing the collective output.

"Randomly" does not mean arbitrarily. The modeler must specify (whether knowingly or not, whether explicitly or implicitly) the intended frequencies of all the inputs. The frequencies of the outputs provide the most detailed summary of the results.

Figure: Random inputs

The same model, shown with random inputs and the resulting (computed) random output.

The figure displays frequencies with histograms to represent distributions of numbers. The intended input frequencies are shown for the inputs at left, while the computed output frequency, obtained by running the model many times, is shown at right.

Each set of inputs to a deterministic model produces a predictable numeric output. When the model is used in a stochastic simulation, however, the output is a distribution (such as the long gray one shown at right). The spread of the output distribution tells us how the model outputs can be expected to vary when its inputs vary.

The preceding code example might be modified like this to turn it into a simulation:

n <- 1e5 # Number of iterations
inputs <- rbind(rgamma(n, 3, 3) - 2,
                runif(n, -2, 2),
                rnorm(n, 0, 1/2))
output <- apply(inputs, 2, sum)
hist(output, freq=FALSE, col="Gray")

Its output has been summarized with a histogram of all the numbers generated by iterating the model with these random inputs:
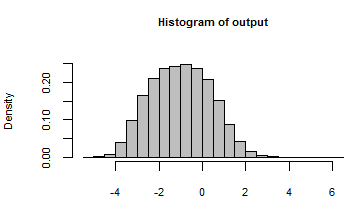
Histogram

Peering behind the scenes, we may inspect some of the many random inputs that were passed to this model:

rownames(inputs) <- c("First", "Second", "Third")
print(inputs[, 1:5], digits=2)

The output shows the first five out of $100,000$ iterations, with one column per iteration:

        [,1]  [,2]  [,3]  [,4]  [,5]
First  -1.62 -0.72 -1.11 -1.57 -1.25
Second  0.52  0.67  0.92  1.54  0.24
Third  -0.39  1.45  0.74 -0.48  0.33

Arguably, the answer to the second question is that simulations can be used everywhere. As a practical matter, the expected cost of running the simulation should be less than the likely benefit. What are the benefits of understanding and quantifying variability? There are two primary areas where this is important:

  • Seeking the truth, as in science and the law. A number by itself is useful, but it is far more useful to know how accurate or certain that number is.

  • Making decisions, as in business and daily life. Decisions balance risks and benefits. Risks depend on the possibility of bad outcomes. Stochastic simulations help assess that possibility.

Computing systems have become powerful enough to execute realistic, complex models repeatedly. Software has evolved to support generating and summarizing random values quickly and easily (as the second R example shows). These two factors have combined over the last 20 years (and more) to the point where simulation is routine. What remains is to help people (1) specify appropriate distributions of inputs and (2) understand the distribution of outputs. That is the domain of human thought, where computers so far have been little help.

$\endgroup$
1
  • 2
    $\begingroup$ what a great answer!. I especially like ""Randomly" does not mean arbitrarily." $\endgroup$
    – Haitao Du
    Commented Jan 31, 2018 at 16:49
34
$\begingroup$

First, let me say that there is no single answer for your question. There is multiple examples of when you can (or have to) use simulation. I will try to give you few examples below. Second, notice that there are multiple ways you can define a "simulation", so the answer at least partly depends on the definition you choose.

Examples:

1. You are a Bayesian statistician, so simulation is your method of choice for doing statistics. There are non-simulation-based ways approaches to Bayesian statistics however in vast majority of cases you use simulation. For learning more check "Bayesian data analysis" book by Gelman (or other possible resources).

2. You want to assess the performance of statistical method. Say you have designed some statistical test $T$ that was designed for estimating some parameter $\theta$ given empirical data. Now you want to check if it really does what you want it to do. You could take some data sample and use your test on this data - however if you need a statistical test to know the $\theta$, then how do you know if your test works fine having only the data..? Of course you can compare the results with estimates of other statistical test, but what if the other test does not estimate $\theta$ correctly..? In this case you can use simulation. What you can do is you generate some fake data given your parameter $\theta$ and then check if your estimated value is the same as true value of $\theta$ (that you know in advance since you have chosen it). Using simulation lets you also to check different scenarios (sample size, different distributions of data, different amount of noise in your data etc.).

3. You don't have the data or it is very limited. Say you want to know what would be the possible outcome of nuclear war. Unfortunately (hopefully) there was no nuclear war before, so you do not have any data. In this case you can use computer simulation where you make some assumptions about reality and then let computers create parallel virtual realities where the nuclear war happens, so you have some samples of possible outcomes.

4. Your statistical model does not fit the software or is complicated. This approach is advocated, for example, by Gelman and Hill in "Data Analysis Using Regression and Multilevel/Hierarchical Models", where they describe simulation-based Bayesian estimation as a "next step" in regression modeling.

5. You want to learn about possible outcomes of a complicated process. Imagine that you want to forecast the future outcome of some complicated process, the problem is however that the behavior of your process is chaotic and given different inputs you get different outputs, while the number of possible inputs is very large. Generally, this was the case because Monte Carlo simulation methods were invented by physicists and mathematicians working on nuclear bomb during World War II. With simulation you try different inputs and gather samples so to get a general idea about the possible outcomes.

6. Your data does not meet the criteria for some statistical method, e.g. it has skewed distribution while it ought to be normal. In some cases this is not really a problem, however sometimes it is, so simulation-based methods like bootstrap were invented.

7. To test a theoretical model against reality. You have a theoretical model than describes some process, e.g. spread of epidemic through a social network. You can use the model to generate some data so that you can compare if the simulated is similar to the real data. Lada Adamic gives a multiple examples of such a usage for Social Network Analysis on her Coursera class (see some demos here).

8. To generate "hypothesis 0" data. You generate a fake (random) data so to compare the real data to it. If there were any significant effects or trends in your data then it should differ from the data generated at random. This approach is advocated by Buja et al. (2009) in their paper "Statistical inference for exploratory data analysis and model diagnostics" where they propose how using plots could facilitate an exploratory data analysis and hypothesis testing (see also documentation of nullabor R package that implements those ideas).

$\endgroup$
22
$\begingroup$

I think that the discussion of TrynnaDoStat's answer illustrates the point well: we use simulations whenever the problem is impossible to solve analytically (e.g. the posterior distributions of parameters in a hierarchical model), or when we're simply too annoyed to put the time into working out the solution analytically.

Based on what I've observed on this website, the threshold of "annoying enough to simulate" varies widely between statistician. People like @whuber can, apparently, glance at a problem and immediately see the solution while mere mortals like myself will have to carefully consider the problem and maybe do some reading before writing a simulation routine to do the hard work.

Keep in mind that simulations aren't necessarily a panacea since with large data sets, or complicated models, or both you'll spend enormous amounts of (computer) time estimating and checking your simulation. It's certainly not worth the effort if you could accomplish the same goal with an hour of careful consideration.

$\endgroup$
14
$\begingroup$

Simulations are often done when you can't get a closed form for something (such as a distribution) or you want a nitty-gritty and fast way to get that something.

For example, say I'm running a logistic regression using one variable $X$ to explain $Y$. I know that distribution of the coefficient $\beta$ for $X$ is asymptotically Normal from MLE theory. But let's say I'm interested in the difference of two estimated probabilities $f(\beta) = P(Y=1|X=1) - P(Y=1|X=0)$. It may be very difficult (or impossible) to derive the exact distribution of this function but, since I know the distribution of $\beta$, I can simulate values from $\beta$ and plug it into $f(\beta)$ to get an empirical distribution.

$\endgroup$
5
  • $\begingroup$ I wouldn't call simulations "fast", those are computationally exhaustive methods and often take a lot more time then done using ML approach. $\endgroup$
    – Tim
    Commented Jan 30, 2015 at 14:47
  • 2
    $\begingroup$ It's a hell of a lot faster than deriving the distribution. $\endgroup$ Commented Jan 30, 2015 at 14:48
  • 3
    $\begingroup$ How often do you run a ML algorithm for more than a week non-stop..? $\endgroup$
    – Tim
    Commented Jan 30, 2015 at 14:57
  • $\begingroup$ Tangent re: "distribution of the coefficient β for X is Normal" - I hadn't thought much about this, but after some simulation, I find it's often not true with subsamples less than about 500 and/or with coefficients whose average is beyond a certain strength, say, +/-3. Sound right? $\endgroup$
    – rolando2
    Commented Feb 13, 2015 at 4:27
  • $\begingroup$ MLE theory tells us that, under certain regularity conditions, the MLE is asymptotically normal. Ill add this to my answer. $\endgroup$ Commented Feb 13, 2015 at 11:56
11
$\begingroup$

Simulations are an excellent way to check whether you can obtain useful estimates from a model.

You would do this by generating/simulating fake data that follows the distribution implied by your model. Then go ahead and fit your model to that data. This is an ideal case: your model is, in fact, true. So if the fit is noisy or inaccurate, then you know there is a problem either with the estimation procedure or the model itself.

Similarly, you can simulate data using the "wrong" data generating process and use that fake data to assess how your estimates are affected by violating model assumptions. This is often called sensitivity analysis.

These points are similar to items 2 and 8 in Tim's answer, and also a somewhat more ad-hoc version of the procedure in whuber's answer.


Simulations are also used to perform predictive model checking as advocated by Andrew Gelman and others. This amounts to plugging your predictor data back into the model and then simulating fake response data from the implied distribution, to see if your simulated data is close enough (by whatever criterion you're using) to the real thing.

Note that this is not the same thing as just computing fitted values. In a regression model, for instance, the fitted values are conditional averages; to run a predictive check on a regression model, you would have to draw once from the Gaussian distribution centered at each fitted value.

$\endgroup$
6
$\begingroup$

The simplest case for simulation. Let's say you have a forecasting model for the number of loan defaults, you also have a model for losses on defaulted loans. Now you need to forecast the total loss which the product of defaults and losses given the default. You can't simply multiply the defaults and losses on defaults to get the confidence intervals of total loss.

The reason is that if you have a random variable $x_i$, of which you know the densities, it doesn't mean that you can easily get the density of the product $x_1\cdot x_2$. On the other hand, if you know the correlation between numbers, it's easy to simulate the correlated numbers, and get the simulated distribution of losses.

This paper has a MBA-level description of this use case for operation risk estimation, where you have the distributions of loss frequency and amounts, and combine them to get the total loss distribution.

$\endgroup$

Not the answer you're looking for? Browse other questions tagged or ask your own question.