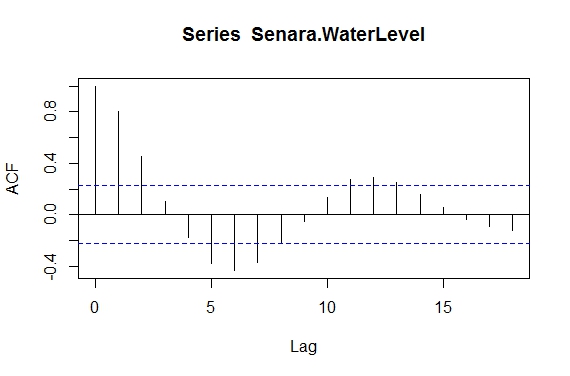
You should complement the statistical tools you are using with your knowledge about the data. What kind of periodicity would you expect? For example, if the data are water levels observed in a river, we could expect monthly or quarterly pattern repeated every year (reflecting fluctuations related to different meteorological conditions in spring, summer, autumn and winter). These patterns cannot be captured in your 76 daily observations, but you should think in this way about your day and see if there are reasons to expect, for example, a weekly cycle. You should think whether there are changes that happen regularly on a scale of, say, 2, 4,7,... days that may affect your data.
As regards your third question, Hylleberg et al. (1990) [1] extend the Dickey and Fuller test for a unit root at a long-run cycle to quarterly series. Beaulieu and Miron (1993) [2] extend the idea to monthly data. Díaz-Emparanza (2014) [3] generalizes this test for series of any periodicity and provides a method to obtain the corresponding p-values.
[1] Hylleberg, S. and Engle, R.F. and Granger, C.W.J. and B.S. Yoo
(1990). "Seasonal Integration and Cointegration". Journal of
Econometrics 44(1-2), pp. 215-238}
https://dx.doi.org/10.1016/0304-4076(90)90080-D.
[2] J. Joseph Beaulieu and Jeffrey A. Miron (1993). "Seasonal Unit Roots
in Aggregate U.S. Data". Journal of Econometrics 55(1-2), pp.
305-328
https://dx.doi.org/10.1016/0304-4076(93)90018-Z}.
[3] Díaz-Emparanza, I. (2014)."Numerical Distribution Functions for
Seasonal Unit Root Tests". Computational Statistics and Data
Analysis 76, pp. 237-247.
https://dx.doi.org/10.1016/j.csda.2013.03.006. (A preliminary working paper is available here.)


