0
$\begingroup$

I have two independent groups, (roughly 30 in each) – and their performance on 3 different tasks, there are 10 scores in total for each group.

The majority of them are negatively skewed so I know I have to reflect the data before I transform it – if the two groups have different maximum scores, do I use different maximums in the transformation formula or do I use the maximum overall?

E.g. Group 1 – Maximum = 36 Group 2 – Maximum = 39

So do I do A) log10(40-Var) – for both groups B) log10(37-Var) – for Group 1, and log10(40-Var) for group 2

And if I am later going to calculate a composite score, do I need to use the same transformation for all of the scores?

There are also a couple of outcomes where the data is negatively skewed for one group and positively skewed for the other – how do I deal with this?

Any help would be massively appreciated :)

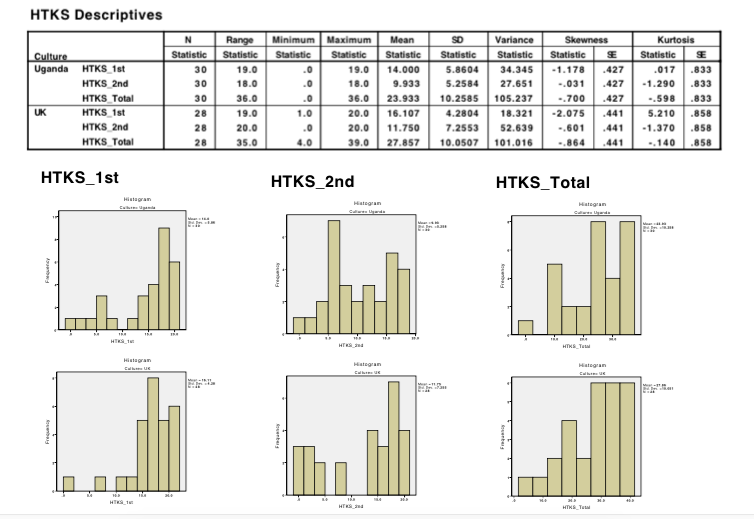
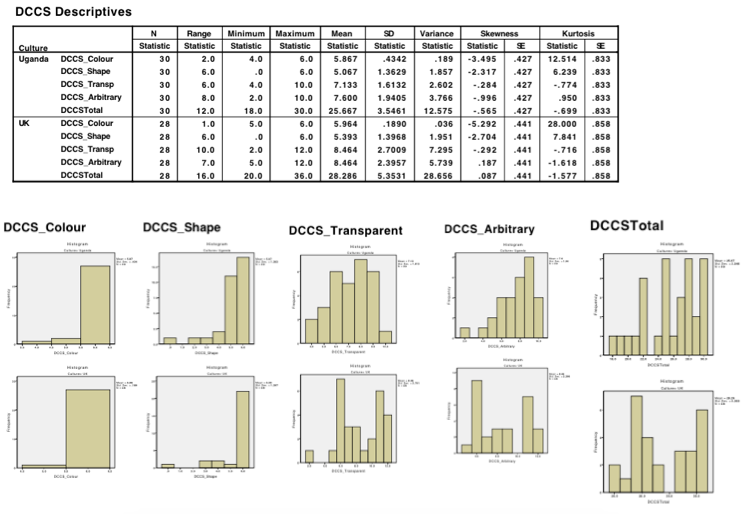
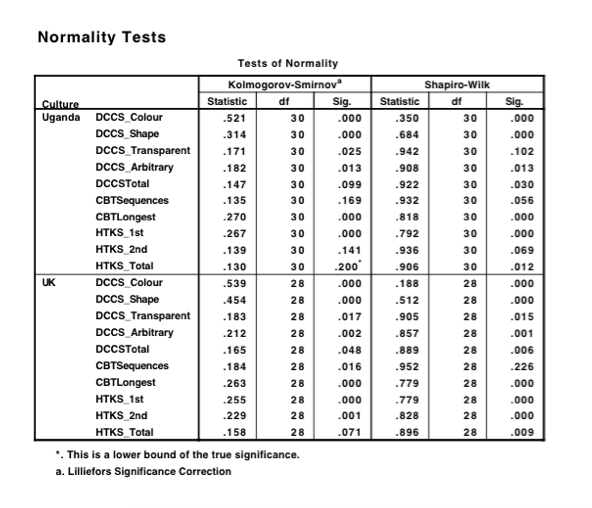
EDIT: Here is some of the data Corsi Blocks Data
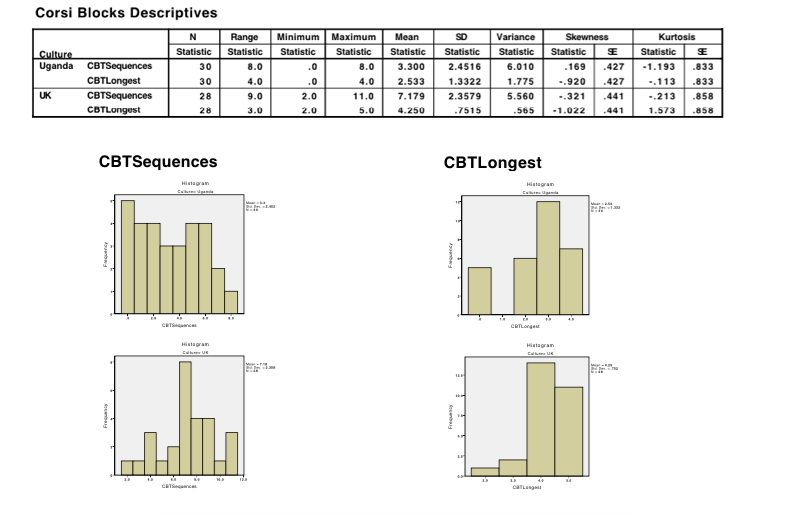
Heads-Toes-Knees-Shoulders Data

DCCS Data

Normality Data

$\endgroup$
1
  • 2
    $\begingroup$ 1) "I know I have to reflect the data before I transform it"... from where does this knowledge arise? 2) if the scores are discrete and values are jammed up at a boundary, no monotonic transformation will do much. 3) It may be better to consider what analysis could be suitable for your data than choosing Procrustes' solution to the problem when things 'don't fit' the assumptions. $\endgroup$
    – Glen_b
    Commented Mar 1, 2015 at 5:33

1 Answer 1

2
$\begingroup$

I think you need to back up here. Why do you think you need to transform the data at all?

In general, if data are to be transformed, they should certainly be transformed in the same way. Also, I'd assert that whenever transformation is useful, the transformation is almost always very simple, with logarithms, square roots and reciprocals leading the pack.

Also, feasible scores should preferably be feasible scores on a transformed scale.

To give better advice, we would need to see the data and know more about your aims.

The details that skewness can be sometimes positive, sometimes negative and that you are thinking of combining scores also hint that you would be better off leaving the data as they are.

The transformation of logarithms of (empirical maximum $+ 1 -$ value) isn't a common one in statistical science. It doesn't sound at all natural for performance scores or indeed have any good rationale.

$\endgroup$
7
  • $\begingroup$ This is for my dissertation and I was told by my supervisor that if the data wasn't normal it would need transforming before running t-tests. It is a cross-cultural comparison of executive functions in children in Uganda and the UK. So the scores are performance on the Advanced DCCS, the Corsi Blocks Task & the Heads-Toes-Knees-Shoulders task. This is why the data are so skewed, because for a number of the sections of the tasks the children perform at ceiling, or at least within each culture all perform at a relatively similar level. There will also be data on verbal fluency and creativity. $\endgroup$
    – cxds
    Commented Mar 1, 2015 at 11:30
  • $\begingroup$ Initially I was planning to run t-tests on each of the measures separately comparing Uganda and the UK, then calculate a composite score and do the same, and then finally look at whether any demographic variables mediate any of the differences between variables in Ug & UK, or any of the relationships between variables. $\endgroup$
    – cxds
    Commented Mar 1, 2015 at 11:30
  • $\begingroup$ Which I think would require the data to be normally distributed? Any suggestions about alternative analysis strategies would be much appreciated $\endgroup$
    – cxds
    Commented Mar 1, 2015 at 11:31
  • $\begingroup$ t-tests often work quite well if data are not normally distributed: see e.g. Rupert G. Miller 1986 Beyond ANOVA New York: John Wiley. The data are "so skewed"; you haven't shown us the data, or any graphs, or even cited results for any skewness measures. $\endgroup$
    – Nick Cox
    Commented Mar 1, 2015 at 12:15
  • $\begingroup$ I have added some of the data to the original question, including skewness measures - does that help at all? $\endgroup$
    – cxds
    Commented Mar 1, 2015 at 13:27

Your Answer

By clicking “Post Your Answer”, you agree to our terms of service and acknowledge you have read our privacy policy.

Not the answer you're looking for? Browse other questions tagged or ask your own question.