In my linear model I have the variable of interest $x$, and a whole bunch of covariates that I condition on. The coefficient is significant and positive. I have reason to believe that the connection between my x and y is best described quadratically, but since my $x$ values range from $-2$ to $2$, and I want to preserve the sign, I cubed it. Now I have $x$ and $x^3$ in my model, and the coefficients are both negative and significant. What does this imply and what should I reasonably infer?
-
1$\begingroup$ If the relationship is truly quadratic, you shouldn't be making it cubic. $\endgroup$– StatsStudentCommented Mar 11, 2015 at 3:19
-
1$\begingroup$ Maybe a quadratic regression with an intercept parameter would model your data better than cubic? $\endgroup$– KishKashCommented Mar 11, 2015 at 4:32
1 Answer
I would say you need a crash course in modeling. What you are doing doesn't make any sense. As both @StatsStudent and @KishKash note, if you believe the relationship is quadratic, you should model it with a quadratic. In addition, if you do include a polynomial term (e.g., a cubic), you should include / retain all lower order terms (see this excellent CV thread: Does it make sense to add a quadratic term but not the linear term to a model?).
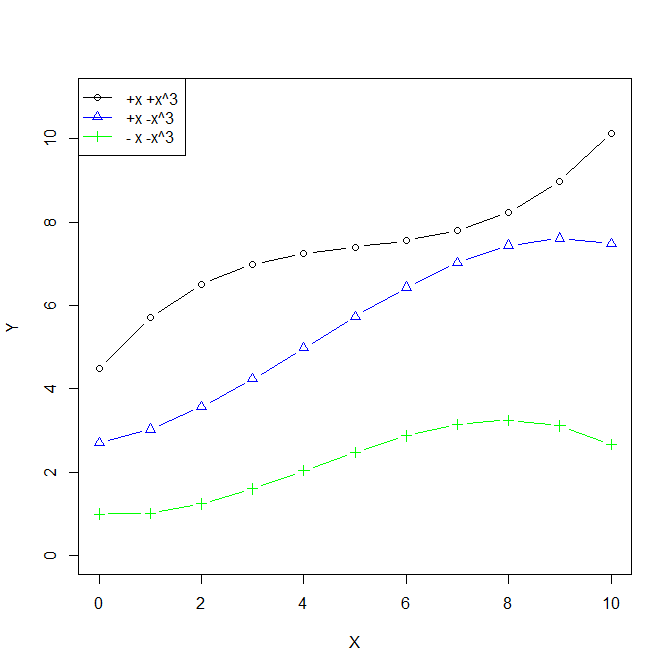
Regarding your specific model and what the terms mean, your best bet is to plot your data with the model's predicted values. A cubic polynomial is very flexible. There are many different ways it can 'wiggle' and still be going generally upwards. Consider these three:

As far as what the terms mean, they have to do with the location of the locations of the points where the curvature changes (see @whuber's answer at the thread linked above for a simple example). In general, I don't think it's productive to try to interpret the location of these points. Take your X variable as a whole. If you have a significant cubic term, you can take that to indicate that you have two 'bends' in the relationship between X and Y in your data.
