0
$\begingroup$

I have two time series A, B. Both are seasonal and B primarily is A driven( other temporal causes may exist). graphs
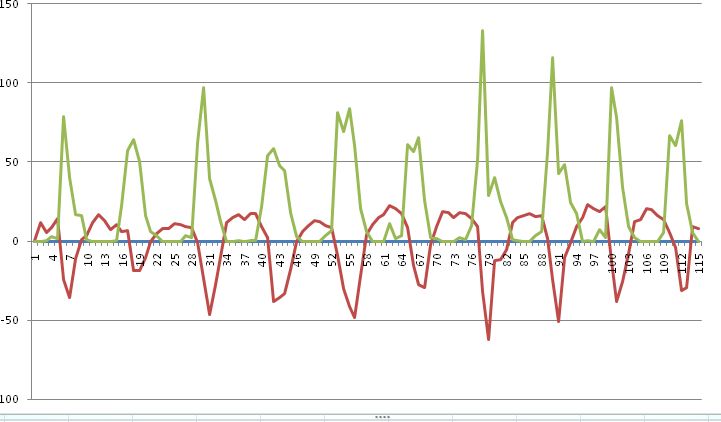
B-Red, A- Green

I want to calculate lag of red series with respect to green as clearly, it exists.

Now, I am taking Spearman's correlation at different lags and choosing the max to decide the lag which gives satisfying answer.

To confirm the confidence in lag, I am trying entropy based methods.

I tried conditional entropy and here are the results.

   lag C-Entropy   corr
    0 1.0820745 -0.735406343
    1 0.8978593 -0.830377446
    2 1.1218689 -0.689623230
    3 1.2412857 -0.336204576
    4 1.2985196  0.054672496
    5 1.2727747  0.485228731
    6 1.1027205  0.771465042
    7 0.9616463  0.839862100
    8 1.1296509  0.677166842
    9 1.2805970  0.396034333
    10 1.3420290  0.005832166

I am confused over this.

1 0.8978593 -0.830377446

Correlation is highly negative while entropy is down?

R code for entropy calculation:

   B_d= discretize(B)
   A_d= discretize( A)
   H <- condentropy(B_d, A_d, method = "mm")

Also, Any suggestions for entropy based methods or options which can be helpful for this situation. I have to find lags over several such pairs and need another metric to evaluate lag calculated from correlation.

$\endgroup$

2 Answers 2

1
$\begingroup$

I think that you are quite wrong in making a way too fast conclusion that it is not possible to use entropy as a similarity measure. Indeed, entropy can be used as a measure of similarity, both in general (Korhonen & Krymolowski, 2002) as well as for autocorrelated processes, such as time series (Liu, Pokharel & Principe, 2006). In particular, Korhonen and Krymolowski, among other similarity measures, describe cross-entropy, which might be useful in your case. Moreover, Liu et al. describe cross-corentropy, which is also referred to simply as correntropy - an information theory-based similarity measure, which extends auto-correntropy function to two random variables.

As an additional aid, you might find helpful the following related answers of mine: on performing time series analysis in R, on time series classification and clustering and (more) on dynamic time warping (disregard the focus on the irregular time series - the information is helpful in general).

References

Korhonen, A., & Krymolowski, Y. (2002). On the Robustness of Entropy-Based Similarity Measures in Evaluation of Subcategorization Acquisition Systems. In Proceedings of The 6th Conference on Natural Language Learning, 91-97. Retrieved from https://aclweb.org/anthology/W/W02/W02-2014.pdf

Liu, W., Pokharel, P. P., & Principe, J. C. (2006). Correntropy: A localized similarity measure. In Proceedings of The International Joint Conference on Neural Networks (IJCNN '06), pp. 4919-4924. doi:10.1109/IJCNN.2006.247192 Retrieved from http://www.cnel.ufl.edu/~weifeng/filesfordownload/paper/localized_similarity_measure.pdf

$\endgroup$
0
$\begingroup$

Apparently, Entropy doesn't give similarity measure as I was expecting but dependence measure. So when two series are having opposite peaks and opposite curve shapes in the same bin, entropy is low (as expected) and correlation is highly negative.

So my understanding was wrong in using conditional entropy as similarity measure as an alternative to correlation. It is a dependence measure. Please correct me If I got it wrong.

$\endgroup$

Your Answer

By clicking “Post Your Answer”, you agree to our terms of service and acknowledge you have read our privacy policy.

Not the answer you're looking for? Browse other questions tagged or ask your own question.