4
$\begingroup$

enter image description here

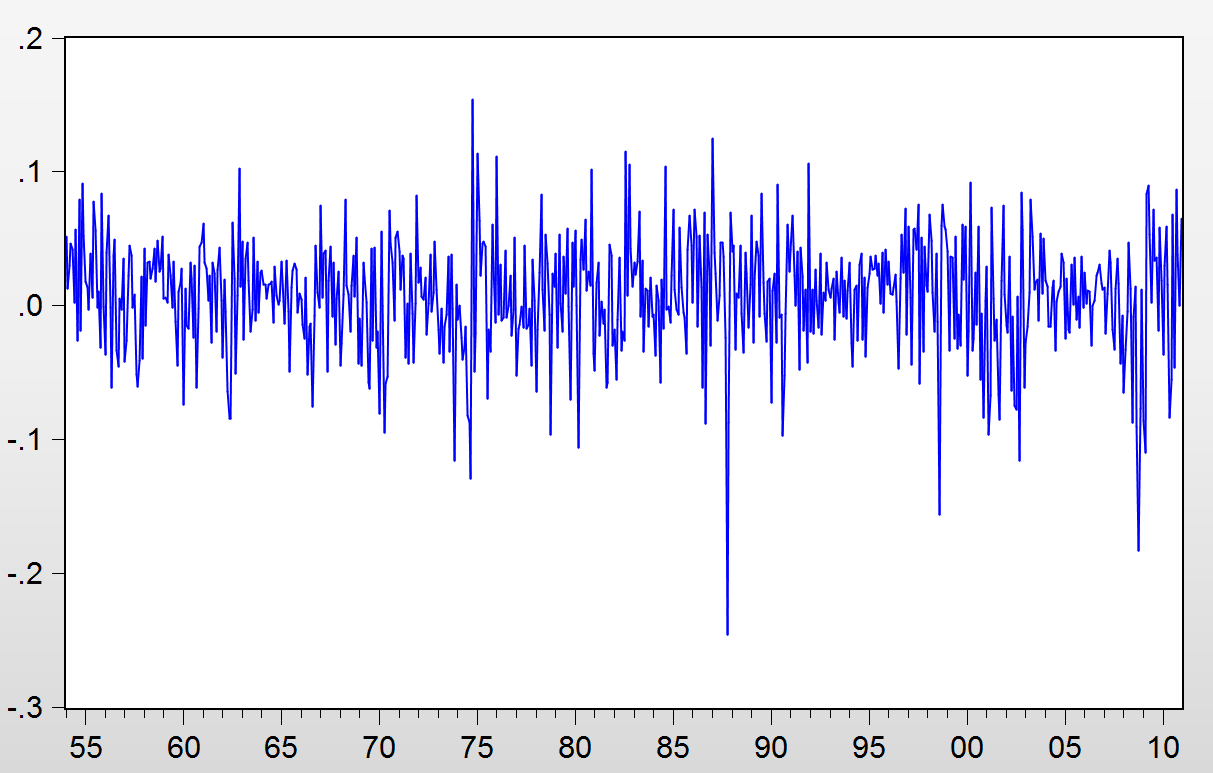
I am trying to specify a state space model for the dependent variable from this graph. As you can see, there clearly seems to be cyclical behaviour. Therefore, I tried to specify the following state space model: enter image description here
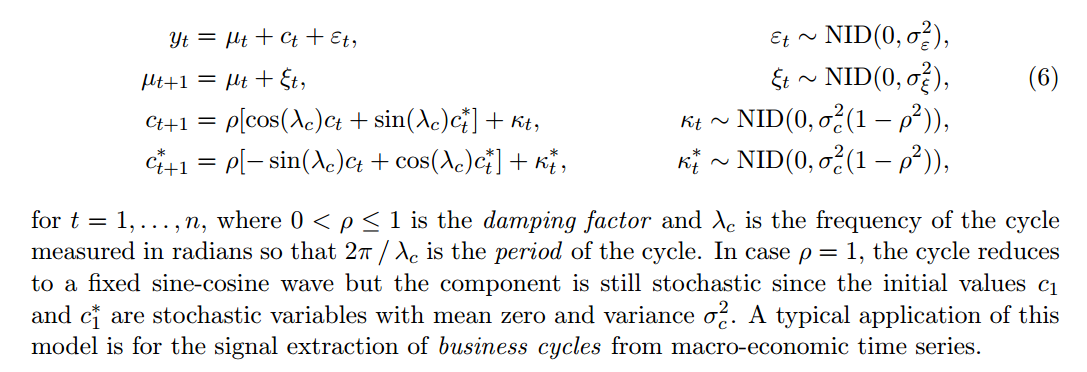
However, I am not sure what I should use for lambda. Does anyone know what this value should approximately be for the data in the plot (the data is monthly)?

For those who are interested, I am using the following code in EViews

@SIGNAL SP500EP = mu +  c1 + beta1*x1(-1)^2+ [var = exp(C(1))]
@state mu = mu(-1) + [var = exp(C(2))]
@STATE c1 = c(3)*(@cos(0.00001)*c1(-1) + @sin(0.00001)*c2(-1)) + [var = exp( c(4)*(1 - c(3)^2) ) ]
@STATE c2 = c(3)*(-@sin(0.00001)*c1(-1)+ @sin(0.00001)*c2(-1)) + [var = exp( c(4)*(1 - c(3)^2) ) ]
@state beta1 = beta1(-1)
@param c(1) 3 c(2) 3 c(3) 3 c(4) 3 c(5) 3 c(6) 3 c(7) 3

As you can see I am currently using the value 0.00001 for lambda as this seems to give the best results but I doubt if its logical. If anyone has any other suggestions for state space models that can capture the cycle from the plot, that would also be helpful!

Thank you in advance!

Edit:

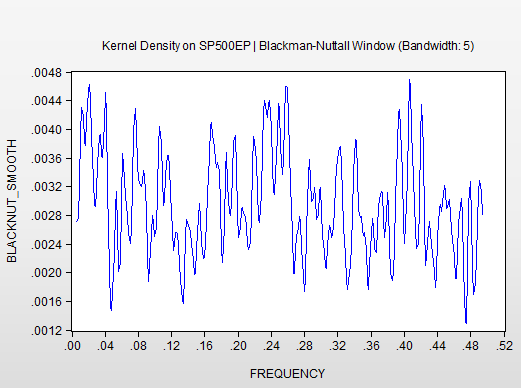
Following up on F. Tusell's suggestion, here the periodogram of the data, can anyone tell me what exactly this tells me about what I should pick for lambda?
enter image description here

$\endgroup$
5
  • $\begingroup$ Are you sure the variance of $\kappa$ is $\sigma^2_c(1-\rho^2)$? isn't it be one of the parameters of the model, $\sigma^2_\kappa$? $\endgroup$
    – javlacalle
    Commented Mar 20, 2015 at 21:06
  • $\begingroup$ @javlacalle The image is taken from a paper so I assume it's correct. I can't be sure though $\endgroup$
    – rbm
    Commented Mar 20, 2015 at 21:10
  • 1
    $\begingroup$ You could try unobserved components model, its a class of state space model that explicitly captures and models, trend+seasonality+cycle+randomness. $\endgroup$
    – forecaster
    Commented Mar 20, 2015 at 21:32
  • $\begingroup$ @forecaster Thank you for your suggestion! Can you show me any specification of that model (preferably also code)? There doesn't really seem to be a trend in my data though, does there? $\endgroup$
    – rbm
    Commented Mar 20, 2015 at 21:33
  • 2
    $\begingroup$ @rbm no there is no trend in your data. I was pointing out the capabilities of UCM. Here is an example in SAS on how to model a simialr series such as yours using UCM. I don't know if eviews has UCM. SAS has one of the more advanced features for UCM/state space modeling. Stata has UCM modeling facility. $\endgroup$
    – forecaster
    Commented Mar 20, 2015 at 21:37

2 Answers 2

2
$\begingroup$

It is not clear to me from your graph neither that you have a prominent cycle nor that there is only one. In addition to what has been already answered, you might want to try a spectral analysis first, to detect hidden periodicities in case there are any.

At the very least you would gain some insight on suitable initial values if you decide later to estimate $\lambda_c$.

$\endgroup$
4
  • $\begingroup$ I posted the 'periodogram' of the dependent variable in the opening post. Is that enough for you to tell me what lambda I should use and hence what my specification should look like? I don't have experience with interpreting it. $\endgroup$
    – rbm
    Commented Mar 21, 2015 at 8:24
  • $\begingroup$ The periodogram is an inconsistent estimator of the spectrum. You should have an option to smooth it, so that peaks --if any-- become apparent. $\endgroup$
    – F. Tusell
    Commented Mar 21, 2015 at 16:40
  • $\begingroup$ Thanks again. Is the plot that I put in the OP now more informative? There does not really seem to be a peak, does there? $\endgroup$
    – rbm
    Commented Mar 21, 2015 at 16:52
  • $\begingroup$ No, no aparent peak. If you are using SP500 returns or something of that kind, this is not surprising. Also, your first plot suggest you have somehow detrended your data, which removes much of the spectral power at low frequencies. $\endgroup$
    – F. Tusell
    Commented Mar 21, 2015 at 22:07
4
$\begingroup$

Instead of guessing its value, you should include $\lambda_c$ in the set of parameters to be estimated by means of some method or rule. For example, you can estimate the parameters by maximum likelihood. Upon the state-space representation of the model, the likelihood function can be evaluated by means of the Kalman filter. The likelihood function can be maximized using a numerical optimization algorithm, the L-BFGS-B optimization algorithm is a good option in this case since it allows setting box-constraints to ensure non-negative variance parameters, $0 \leq \rho \leq 1$ and $0 \leq \lambda_c \leq \pi$.

In this answer you can find some useful references on alternative methods to fit this kind of models.

$\endgroup$
5
  • $\begingroup$ Thank you for your help, I appreciate it. However can you be a bit more specific about 'some method or rule'. More specifically, would you know how I should alter my code or how I could code that in some other language/program? $\endgroup$
    – rbm
    Commented Mar 20, 2015 at 20:19
  • $\begingroup$ Maximum likelihood is a common method to fit the time series model defined in your question. In my answer above I sketch the overall idea to implement it, but you don't need to do it by yourself. See the references in the link that I gave, the Special Volume Statistical Software for State Space Method of the Journal of Statistical Software includes sample code to fit these models in EViews and in many other software packages. $\endgroup$
    – javlacalle
    Commented Mar 20, 2015 at 20:46
  • $\begingroup$ Thanks, but the thing is that I'm specifically looking for code for a state space model with cycle, and that is quite hard to find. So I'm afraid that unless I can find exactly a model that includes a cycle there it doesn't really help me much. $\endgroup$
    – rbm
    Commented Mar 20, 2015 at 21:12
  • $\begingroup$ If you write yor model in state space form, the software packages introduced in the reference that I gave can be used to fit your model. $\endgroup$
    – javlacalle
    Commented Mar 20, 2015 at 21:24
  • $\begingroup$ Thanks again, I will look in more detail into your link soon. But the thing is, I tried coding it in eviews but I didn't succeed so I am looking for actual examples in code that are similar and that work. $\endgroup$
    – rbm
    Commented Mar 20, 2015 at 21:28

Your Answer

By clicking “Post Your Answer”, you agree to our terms of service and acknowledge you have read our privacy policy.

Not the answer you're looking for? Browse other questions tagged or ask your own question.