2
$\begingroup$

I am using a program that draws random values in a log-uniform distribution let say between 1 and 100. When I plot the density of the produced values with R it looks like a log-uniform distribution with high density for small values and low densities for higher values. But if I plot the density of the logarithm of the values [i.e. y = density(log(x))] then the density that should be uniform is undulating for small values of x and stabilizing like a uniform for bigger values. (See black line in example graph below.)
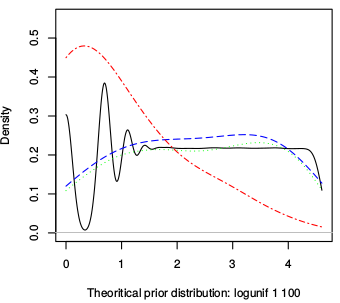
Example plot of density(log(x))

My explanation is that there is some rounding going on before taking the logarithm and that this causes the oscillation for small values because they are more affected by the rounding than bigger values.

  1. Does that make sense? Did someone experience a similar problem before?
  2. Would anyone have an idea on how to fix it (without having to 'unround' the values which are given by the C program)?
  3. Should I just increase smoothing?
  4. Would it be possible to have a more smoothing for small values than for bigger values? Or a different kernel? Would that help? Is that "scientifically" correct?
$\endgroup$
2
  • 2
    $\begingroup$ If I try x <- 100^runif(1000000); plot(density(log(x))) then I get something which looks sensible between $0$ and about $4.6 \approx \log_e(100)$, so what did you run to get that oscillation? $\endgroup$
    – Henry
    Commented Apr 14, 2015 at 18:42
  • $\begingroup$ Thanks for the answer and for the line of code (I did not know how to reproduce it with R.) The prior is drawn by an independent C program that I theoretically cannot change. I really think that it comes from the rounding. If you simulate x <- round(100^runif(1000000)); plot(density(log(x))) you get the same kind of oscillations. But since I cannot change the rounding, I am just wandering how to deal with it? (Questions 2 to 4) $\endgroup$
    – Prolix
    Commented Apr 15, 2015 at 8:50

1 Answer 1

1
$\begingroup$

Let's use the R version, because we can all reproduce it

If I do

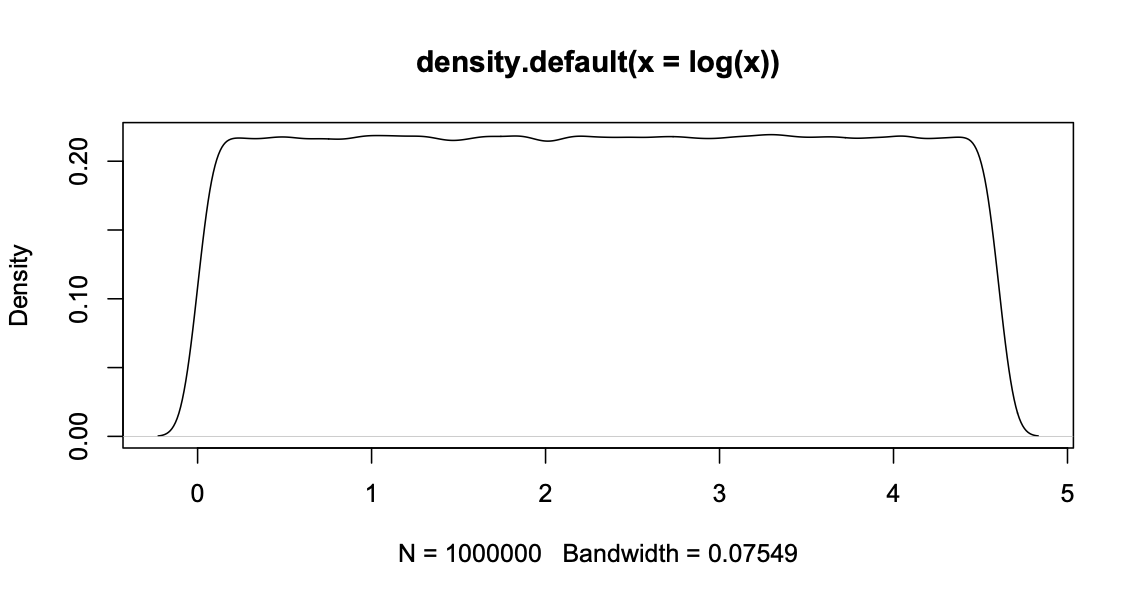
x <-100^runif(1000000); plot(density(log(x)))

I get

uniform-looking density

However, if I do

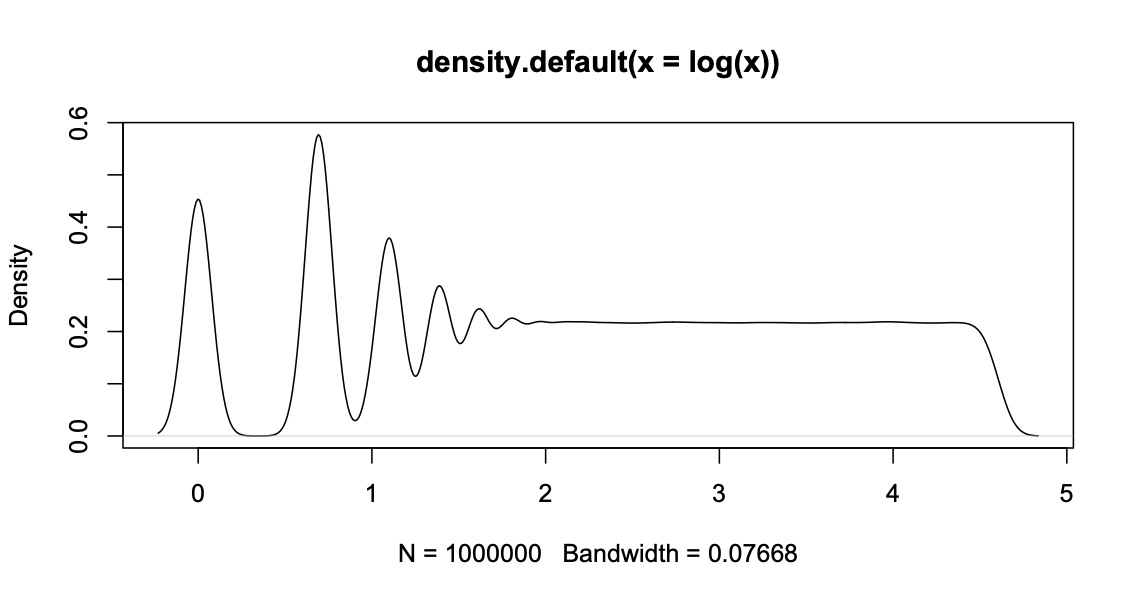
x <- round(100^runif(1000000)); plot(density(log(x)))

I get the sort of thing you see (setting a bandwidth of 0.1 gets you closer)

wiggles

Looking at table(log(x))[1:10] you see that the discrete values are at log(1), log(2), log(3)`, and so on, and they get closer together, with smaller counts, as $x$ increases:

                0 0.693147180559945  1.09861228866811  1.38629436111989   1.6094379124341 
            87807            111514             72896             54910             43344 
 1.79175946922805  1.94591014905531  2.07944154167984  2.19722457733622  2.30258509299405 
            36324             31011             27164             24285             21628 

It looks as if the C program is rounding to the nearest integer. You could smooth more, but you'll end up spreading the offending probability below zero and above where the graph is now smooth. You really need a varying smoothing bandwidth.

$\endgroup$

Your Answer

By clicking “Post Your Answer”, you agree to our terms of service and acknowledge you have read our privacy policy.

Not the answer you're looking for? Browse other questions tagged or ask your own question.