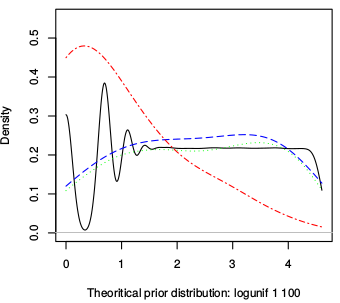
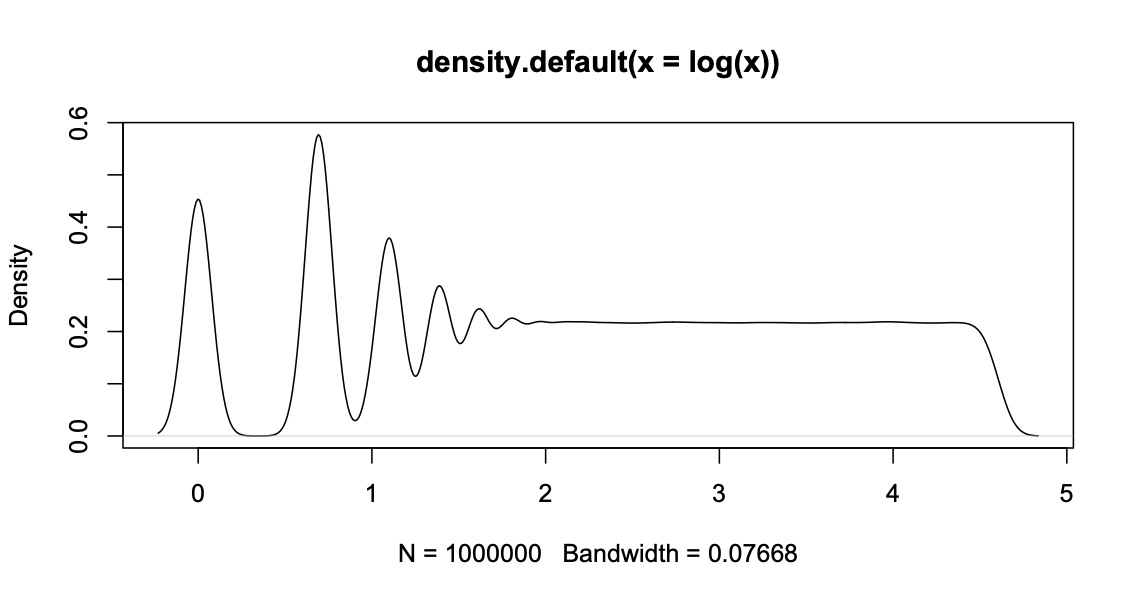
I am using a program that draws random values in a log-uniform distribution let say between 1 and 100. When I plot the density of the produced values with R it looks like a log-uniform distribution with high density for small values and low densities for higher values. But if I plot the density of the logarithm of the values [i.e. y = density(log(x))] then the density that should be uniform is undulating for small values of x and stabilizing like a uniform for bigger values. (See black line in example graph below.)

My explanation is that there is some rounding going on before taking the logarithm and that this causes the oscillation for small values because they are more affected by the rounding than bigger values.
- Does that make sense? Did someone experience a similar problem before?
- Would anyone have an idea on how to fix it (without having to 'unround' the values which are given by the C program)?
- Should I just increase smoothing?
- Would it be possible to have a more smoothing for small values than for bigger values? Or a different kernel? Would that help? Is that "scientifically" correct?


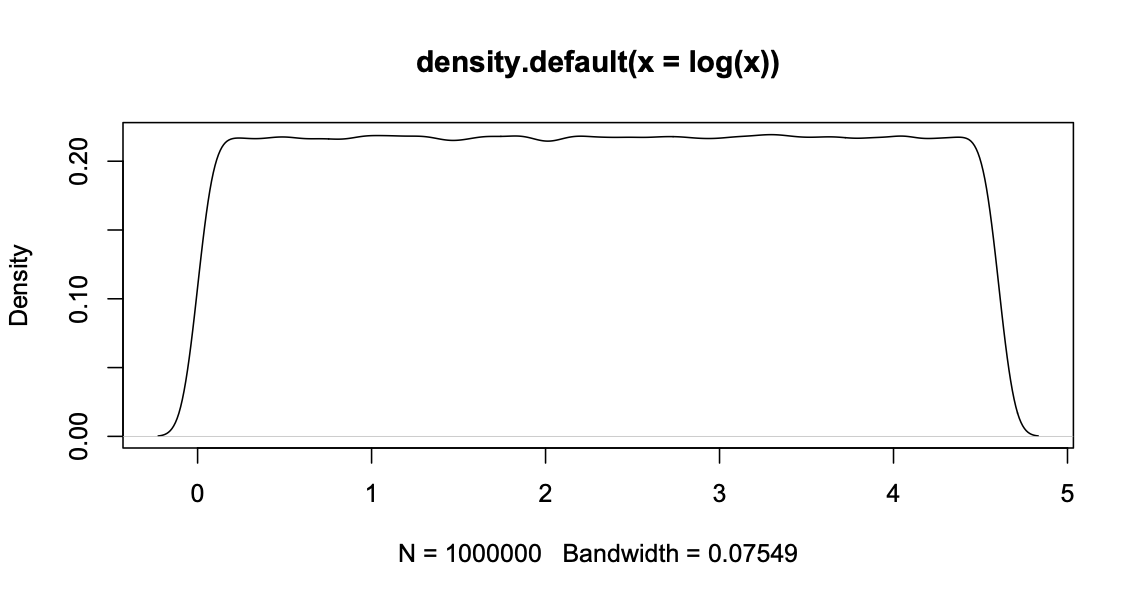
x <- 100^runif(1000000); plot(density(log(x)))then I get something which looks sensible between $0$ and about $4.6 \approx \log_e(100)$, so what did you run to get that oscillation? $\endgroup$x <- round(100^runif(1000000)); plot(density(log(x)))you get the same kind of oscillations. But since I cannot change the rounding, I am just wandering how to deal with it? (Questions 2 to 4) $\endgroup$