111
$\begingroup$

What techniques are available for collapsing (or pooling) many categories to a few, for the purpose of using them as an input (predictor) in a statistical model?


Consider a variable like college student major (discipline chosen by an undergraduate student). It is unordered and categorical, but it can potentially have dozens of distinct levels. Let's say I want to use major as a predictor in a regression model.

Using these levels as-is for modeling leads to all sorts of issues because there are just so many. A lot of statistical precision would be thrown away to use them, and the results are hard to interpret. We're rarely interested in specific majors -- we're much more likely to be interested in broad categories (subgroups) of majors. But it isn't always clear how to divide up the levels into such higher-level categories, or even how many higher-level categories to use.

For typical data I would be happy to use factor analysis, matrix factorization, or a discrete latent modeling technique. But majors are mutually exclusive categories, so I'm hesitant to exploit their covariance for anything.

Furthermore I don't care about the major categories on their own. I care about producing higher-level categories that are coherent with respect to my regression outcome. In the binary outcome case, that suggests to me something like linear discriminant analysis (LDA) to generate higher-level categories that maximize discriminative performance. But LDA is a limited technique and that feels like dirty data dredging to me. Moreover any continuous solution will be hard to interpret.

Meanwhile something based on covariances, like multiple correspondence analysis (MCA), seems suspect to me in this case because of the inherent dependence among mutually exclusive dummy variables -- they're better suited for studying multiple categorical variables, rather than multiple categories of the same variable.

edit: to be clear, this is about collapsing categories (not selecting them), and the categories are predictors or independent variables. In hindsight, this problem seems like an appropriate time to "regularize 'em all and let God sort 'em out". Glad to see this question is interesting to so many people!

$\endgroup$
10
  • 3
    $\begingroup$ In my comment at stats.stackexchange.com/questions/230636/… I have a long list of similar questions in here! Have a look ... Also, search this site with keywords "many levels" you find many similar questions, few good answers. $\endgroup$ Commented Sep 20, 2016 at 16:45
  • 3
    $\begingroup$ I will come back to this when I have time ... in the meantime, the following is a very relevant paper which seems to answer the question, in part: epub.ub.uni-muenchen.de/12164/1/petry_etal_TR102_2011.pdf $\endgroup$ Commented Sep 20, 2016 at 17:03
  • 2
    $\begingroup$ I don't think I get the question, my natural impulse would actually be to add more dummy variables to encode the hierarchies (arguably as many different hierarchies as you can think of ) and then use L1/L2 regularisation to ensure that top level categories are selected rather than the finer level categories. the problem with majors etc is that there is obviously no similarity ( when represented as a dummy variable ) so to get a good model (which allows generalisation) you need to provide that similarity $\endgroup$
    – seanv507
    Commented Sep 26, 2016 at 15:54
  • 1
    $\begingroup$ @ssdecontrol, yea, my prototypical example is telephone numbers (or other IDs) . Basically the correct answer when asked how to model using these is - don't! $\endgroup$
    – seanv507
    Commented Sep 26, 2016 at 16:21
  • 3
    $\begingroup$ If you want to infer hierarchies, you can look into Neural network embedding schemes. Essentially they use a reduced set of neurons between categories and rest of model, so that model must find linear projections of similar categories in solving. It is essentially a non linearised version of factorisation machines.tensorflow.org/guide/embedding $\endgroup$
    – seanv507
    Commented Dec 30, 2018 at 10:29

6 Answers 6

64
+100
$\begingroup$

If I understood correctly, you imagine a linear model where one of the predictors is categorical (e.g. college major); and you expect that for some subgroups of its levels (subgroups of categories) the coefficients might be exactly the same. So perhaps the regression coefficients for Maths and Physics are the same, but different from those for Chemistry and Biology.

In a simplest case, you would have a "one way ANOVA" linear model with a single categorical predictor: $$y_{ij} = \mu + \alpha_i + \epsilon_{ij},$$ where $i$ encodes the level of the categorical variable (the category). But you might prefer a solution that collapses some levels (categories) together, e.g. $$\begin{cases}\alpha_1=\alpha_2, \\ \alpha_3=\alpha_4=\alpha_5.\end{cases}$$

This suggests that one can try to use a regularization penalty that would penalize solutions with differing alphas. One penalty term that immediately comes to mind is $$L=\omega \sum_{i<j}|\alpha_i-\alpha_j|.$$ This resembles lasso and should enforce sparsity of the $\alpha_i-\alpha_j$ differences, which is exactly what you want: you want many of them to be zero. Regularization parameter $\omega$ should be selected with cross-validation.


I have never dealt with models like that and the above is the first thing that came to my mind. Then I decided to see if there is something like that implemented. I made some google searches and soon realized that this is called fusion of categories; searching for lasso fusion categorical will give you a lot of references to read. Here are a few that I briefly looked at:

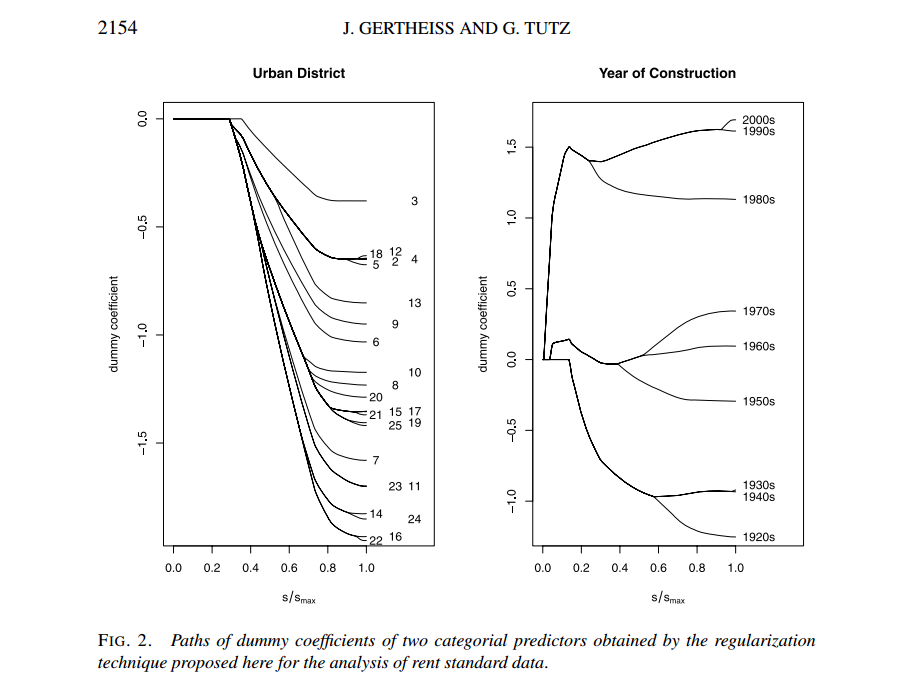
Gertheiss and Tutz 2010, published in the Annals of Applied Statistics, looks like a recent and very readable paper that contains other references. Here is its abstract:

Shrinking methods in regression analysis are usually designed for metric predictors. In this article, however, shrinkage methods for categorial predictors are proposed. As an application we consider data from the Munich rent standard, where, for example, urban districts are treated as a categorial predictor. If independent variables are categorial, some modifications to usual shrinking procedures are necessary. Two $L_1$-penalty based methods for factor selection and clustering of categories are presented and investigated. The first approach is designed for nominal scale levels, the second one for ordinal predictors. Besides applying them to the Munich rent standard, methods are illustrated and compared in simulation studies.

I like their Lasso-like solution paths that show how levels of two categorical variables get merged together when regularization strength increases:

Gertheiss and Tutz 2010

$\endgroup$
3
  • 2
    $\begingroup$ And only after writing all that I noticed that @Kjetil gave a link to one of the papers by Tutz already a week ago... $\endgroup$
    – amoeba
    Commented Sep 26, 2016 at 15:27
  • 1
    $\begingroup$ Thanks for digging into the literature on this! This is definitely a good starting point, especially having a name for this technique ("fusion") that I can search for $\endgroup$ Commented Sep 26, 2016 at 16:10
  • $\begingroup$ A Bayesian treatment of variable fusion can be found here. $\endgroup$
    – cdlm
    Commented Jan 18, 2022 at 1:26
13
$\begingroup$

I've wrestled with this on a project I've been working on, and at this point I've decided there really isn't a good way to fuse categories and so I'm trying a hierarchical/mixed-effects model where my equivalent of your major is a random effect.

Also, in situations like this there seem to actually be two fusing decisions to make: 1) how to fuse the categories you have when you fit the model, and 2) what fused category becomes "other" where you will by default include any new majors that someone dreams up after you fit your model. (A random effect can handle this second case automatically.)

When the fusing has any judgement involved (as opposed to totally automated procedures), I'm skeptical of the "other" category which is often a grab bag of the categories with few things in them rather than any kind of principled grouping.

A random effect handles a lot of levels, dynamically pools ("draws strength from") different levels, can predict previously-unseen levels, etc. One downside might be that the distribution of the levels is almost always assumed to be normal.

$\endgroup$
1
10
$\begingroup$

If you have an auxiliary independent variable that is logical to use as an anchor for the categorical predictor, consider the use of Fisher's optimum scoring algorithm, which is related to his linear discriminant analysis. Suppose that you wanted to map the college major into a single continuous metric, and suppose that a proper anchor is a pre-admission SAT quantitative test score. Compute the mean quantitative score for each major and replace the major with that mean. You can readily extend this to multiple anchors, creating more than one degree of freedom with which to summarize major.

Note that unlike some of the earlier suggestions, optimum scoring represents an unsupervised learning approach, so the degrees of freedom (number of parameters estimated against Y) are few and well defined, resulted in proper statistical inference (if frequentist, accurate standard errors, confidence (compatibility) intervals, and p-values).

I do very much like the penalization suggestion by https://stats.stackexchange.com/users/28666/amoeba @amoeba.

$\endgroup$
3
  • $\begingroup$ Is optimal scoring the method described on slide 15 of this lecture? It's a bit hard to search for those terms, all of them being common in other contexts. $\endgroup$ Commented Dec 31, 2018 at 15:14
  • 3
    $\begingroup$ I'm 0.85 sure it is $\endgroup$ Commented Dec 31, 2018 at 19:46
  • $\begingroup$ This sounds like (a better) version of the idea of target encoding from machine learning, for instance stats.stackexchange.com/questions/398903/… $\endgroup$ Commented Oct 13, 2019 at 10:18
10
$\begingroup$

One way to handle this situation is to recode the categorical variable into a continuous one, using what is known as "target coding" (aka "impact coding") [1]. Let $Z$ be an input variable with categorical levels ${z^1, ..., z^K }$, and let $Y$ be the output/target/response variable. Replace $Z$ with $\operatorname{Impact}\left(Z\right)$, where

$$ \operatorname{Impact}\left(z^k\right) = \operatorname{E}\left(Y\ |\ Z = z^k\right) - \operatorname{E}\left(Y\right) $$

for a continuous-valued $Y$. For binary-valued $Y$, use $\operatorname{logit} \circ \operatorname{E}$ instead of just $\operatorname{E}$.

There is a Python implementation in the category_encoders library [2].

A variant called "impact coding" has been implemented in the R package Vtreat [3][4]. The package (and impact coding itself) is described in an article by those authors from 2016 [5], and in several blog posts [6]. Note that the current R implementation does not handle multinomial (categorical with more than 2 categories) or multivariate (vector-valued) responses.

  1. Daniele Micci-Barreca (2001). A Preprocessing Scheme for High-Cardinality Categorical Attributes in Classification and Prediction Problems. ACM SIGKDD Explorations Newsletter, Volume 3, Issue 1, July 2001, Pages 27-32. https://doi.org/10.1145/507533.507538
  2. Category Encoders. http://contrib.scikit-learn.org/categorical-encoding/index.html
  3. John Mount and Nina Zumel (2017). vtreat: A Statistically Sound 'data.frame' Processor/Conditioner. R package version 0.5.32. https://CRAN.R-project.org/package=vtreat
  4. Win-Vector (2017). vtreat. GitHub repository at https://github.com/WinVector/vtreat
  5. Zumel, Nina and Mount, John (2016). vtreat: a data.frame Processor for Predictive Modeling. 1611.09477v3, ArXiv e-prints. Available at https://arxiv.org/abs/1611.09477v3.
  6. http://www.win-vector.com/blog/tag/vtreat/
$\endgroup$
10
  • $\begingroup$ What is logit E? Could you please share the formula itself? $\endgroup$ Commented Nov 27, 2018 at 18:21
  • $\begingroup$ @OptimusPrime logit E is the logit of the expectation $\endgroup$ Commented Nov 28, 2018 at 13:06
  • $\begingroup$ Okay. So in that case, Impact(zk)=log(E(Y | Z=zk)−E(Y)) OR Impact(zk)=log(E(Y | Z=zk))−log(E(Y))? $\endgroup$ Commented Nov 30, 2018 at 20:11
  • 4
    $\begingroup$ This is supervised learning and will take complex adjustments to recognize the number of degrees of freedom that are being "stolen" from Y. $\endgroup$ Commented Dec 30, 2018 at 13:09
  • 4
    $\begingroup$ For sure - any method that uses Y to guide how the categories are handled for the categorical predictor will be subject to overfitting and it will be difficult to get uncertainty intervals to be wide enough to be accurate. I was focusing on unsupervised learning so those problems don't occur. $\endgroup$ Commented Dec 30, 2018 at 16:20
4
$\begingroup$

There are multiple questions here, and some of them are asked & answered earlier. If the problem is computation taking a long time: There are multiple methods to deal with that, see large scale regression with sparse feature matrix and the paper by Maechler and Bates.

But it might well be that the problem is with modeling, I am not so sure that the usual methods of treating categorical predictor variables really give sufficient guidance when having categorical variables with very many levels, see this site for the tag [many-categories]. There are certainly many ways one could try, one could be (if this is a good idea for your example I cannot know, you didn't tell us your specific application) a kind of hierarchical categorical variable(s), that is, inspired by the system used in biological classification, see https://en.wikipedia.org/wiki/Taxonomy_(biology). There an individual (plant or animal) is classified first to Domain, then Kingdom, Phylum, Class, Order, Family, Genus and finally Species. So for each level in the classification you could create a factor variable. If your levels, are, say, products sold in a supermarket, you could create a hierarchical classification starting with [foodstuff, kitchenware, other], then foodstuff could be classified as [meat, fish, vegetables, cereals, ...] and so on. Just a possibility, which gives a prior hierarchy, not specifically related to the outcome.

But you said:

I care about producing higher-level categories that are coherent with respect to my regression outcome.

Then you could try fused lasso, see other answers in this thread, which could be seen as a way of collapsing the levels into larger groups, entirely based on the data, not a prior organization of the levels as implied by my proposal of a hierarchical organization of the levels.

$\endgroup$
1
  • 1
    $\begingroup$ I like your suggestion about a hierarchy, but could you suggest how to choose what final factors to include? If we include factors from Domain all the way to Species, aren't we simply introducing more factors (higher-level classes) and thus making the initial problem of too many categories worse? Thanks a lot $\endgroup$
    – Dudelstein
    Commented Oct 18, 2023 at 9:49
2
$\begingroup$

The paper "A preprocessing scheme for high-cardinality categorical attributes in classification and prediction problems" leverages hierarchical structure in the category attributes in a nested 'empirical Bayes' scheme at every pool/level to map the categorical variable into a posterior class probability, which can be used directly or as an input into other models.

$\endgroup$
1
  • $\begingroup$ This is basically what @Wayne suggested (mixed effects models ~ frequentist version of Bayesian hierarchical models), and what I suggested in comment to question. However OP wants to infer hierarchies. $\endgroup$
    – seanv507
    Commented Dec 30, 2018 at 10:23

Not the answer you're looking for? Browse other questions tagged or ask your own question.