1
$\begingroup$

According to Wikipedia, to evaluate significance of the Spearman rank correlation, you can use:

$$t = r \sqrt{\frac{n-2}{1-r^2}}$$

but I don't understand how to use this or how this generates the values as shown here:

http://web.anglia.ac.uk/numbers/biostatistics/spearman/local_folder/critical_values.html

Nothing I try matches and online explanations are scarce.

$\endgroup$
5
  • 1
    $\begingroup$ how to use this. Isn't it that t to plug into Student's distribution with n-2 df? $\endgroup$
    – ttnphns
    Commented May 5, 2015 at 20:26
  • $\begingroup$ Apparently, but none of it matches the critical value tables so I don't know how to use any of this. $\endgroup$
    – user62753
    Commented May 5, 2015 at 20:26
  • $\begingroup$ Your formula is incorrect (you have an extra $r$): $$t = \sqrt{\frac{n-2}{1-r_{s}^{2}}}$$ $\endgroup$
    – Alexis
    Commented May 5, 2015 at 20:32
  • $\begingroup$ @Alexis See en.wikipedia.org/wiki/… $\endgroup$
    – user62753
    Commented May 5, 2015 at 20:33
  • $\begingroup$ My mistake! Confused formula for the standard error of $r_{s}$. :) $\endgroup$
    – Alexis
    Commented May 5, 2015 at 22:05

2 Answers 2

3
$\begingroup$

There's no great mystery here.

  1. The distribution of the Spearman correlation is discrete. (The set of ranks of $n$ values are discrete, so the Spearman correlation will necessarily be discrete.)

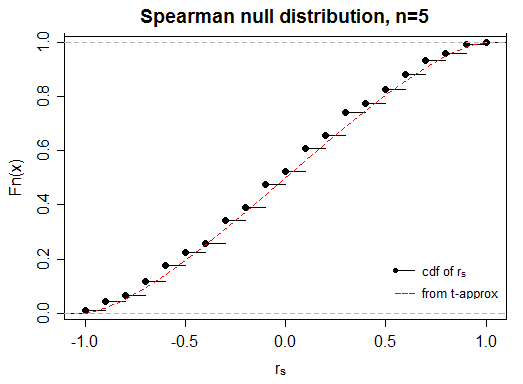
  2. The relevant Wikipedia page lists several approximations for the distribution of the Spearman correlation coefficient; I think the t-approximation is the second listed. The resulting p-values are not exact in small samples (but are reasonably close considering it's a continuous approximation of a discrete distribution - see the plot).

  3. Since the exact small sample distribution (under the null) for the Spearman correlation can be computed, exact small sample tables exist. The table you link to appears to be a table of critical correlations (yielding type I error no greater than the listed significance levels) derived from the exact distribution.

enter image description here

A continuity correction would probably help here.

Edit: actually, it looks like a suitable continuity correction helps quite a lot overall (however it's slightly less accurate for small portions of the range of $r_s$, so while most of the time it improves the approximation, sometimes it doesn't).

--

How to use the t-statistic that Wikipedia gives: you can get one- or two-tailed p-values from the cdf of the $t$ with $n-2$ d.f. just in the same way as you would for any t-statistic with given degrees of freedom.

You can get critical values from the inverse CDF of the $t$. As noted above, these will be approximate, but the approximation kicks in pretty quickly. You don't need very large $n$ before it's suitable for most purposes.

$\endgroup$
8
  • $\begingroup$ Is there a way to compute such values directly without using R or Stata, etc? $\endgroup$
    – user62753
    Commented May 6, 2015 at 2:38
  • $\begingroup$ What values are we computing? p-values? critical values? If critical values, for what statistic? $\endgroup$
    – Glen_b
    Commented May 6, 2015 at 2:39
  • $\begingroup$ Any/all of it. I've been searching for this sort of thing all day long (literally) with little success because of how vague everything is. I don't like solutions that are basically "just use this table" or "use this pt() function in R". I want to actually understand what everything means so I can write the code myself. I can write the code but I just need to know what it is I need to actually compute! $\endgroup$
    – user62753
    Commented May 6, 2015 at 2:41
  • 1
    $\begingroup$ Wait ... you want me to teach you enough to write code for it? How much time am I to invest in this enterprise? $\endgroup$
    – Glen_b
    Commented May 6, 2015 at 2:43
  • $\begingroup$ @Glen_b Well this is all free / open to the courtesy of people willing to spend time, so technically, nothing is expected. That being said, what I have in mind shouldn't take more than a minute or two for someone who is sufficiently well versed in the material. What I mean is stuff like "if you have a spearman / pearson r value, you can compute the p values this way, the values should match this table, this is what a critical value is and how it's computed, etc." If some nasty distribution is involved I can just write a binary search or numeric integration approximator, no big deal. $\endgroup$
    – user62753
    Commented May 6, 2015 at 2:45
0
$\begingroup$

Here's how reconcile your table. For instance, look at the df=15 and $\alpha=0.05$, you see the critical value 0.446. Plug this thing into the formula, and look at the value of cumulative distribution function of Student t distribution with df=15-2. Here's the code in R:

> pt(0.446*sqrt(13/(1-0.446^2)),13)
[1] 0.9521751

You see that the right tail is about 5%, so, for two tailed test you get 10% in the tails - exactly what you asked with $\alpha=0.1$.

The formula in Wikipedia tell you that the expression is from Student t with n-2 degrees of freedom. Btw, this is how MATLAB calculates Spearman's critical value when there's a tie. Otherwise, it uses AS89 algo, to which I referred you in your other thread, but you didn't seem to like it :)

$\endgroup$
5
  • $\begingroup$ In general I don't like using functions I don't understand. I prefer being able to compute everything in my own program so I know all the guts and details. $\endgroup$
    – user62753
    Commented May 6, 2015 at 2:38
  • $\begingroup$ @user62753, it's a good principled position, but at some point you got to stop. You're not going to implement exp and log, I'm assuming. You may claim that you understand them, but do you really? I bet you don't know how exactly exp is implemented inside CPU. $\endgroup$
    – Aksakal
    Commented May 6, 2015 at 2:44
  • $\begingroup$ I have implemented them before in the past, actually. I understand how exp() is computed with respect to mathematics. In the CPU there may be other optimizations. But that's a one-off example. I don't need to know everything, but for things like statistics where even the high-level concepts are hard to understand, I want to actually implement the stuff. $\endgroup$
    – user62753
    Commented May 6, 2015 at 2:50
  • $\begingroup$ Sort of like how you study better when you write and take notes. For me, I learn better when I actually write code. $\endgroup$
    – user62753
    Commented May 6, 2015 at 2:51
  • $\begingroup$ @user62753 the best way to learn is to look at the actual code. $\endgroup$
    – Aksakal
    Commented May 6, 2015 at 3:01

Your Answer

By clicking “Post Your Answer”, you agree to our terms of service and acknowledge you have read our privacy policy.

Not the answer you're looking for? Browse other questions tagged or ask your own question.