0
$\begingroup$

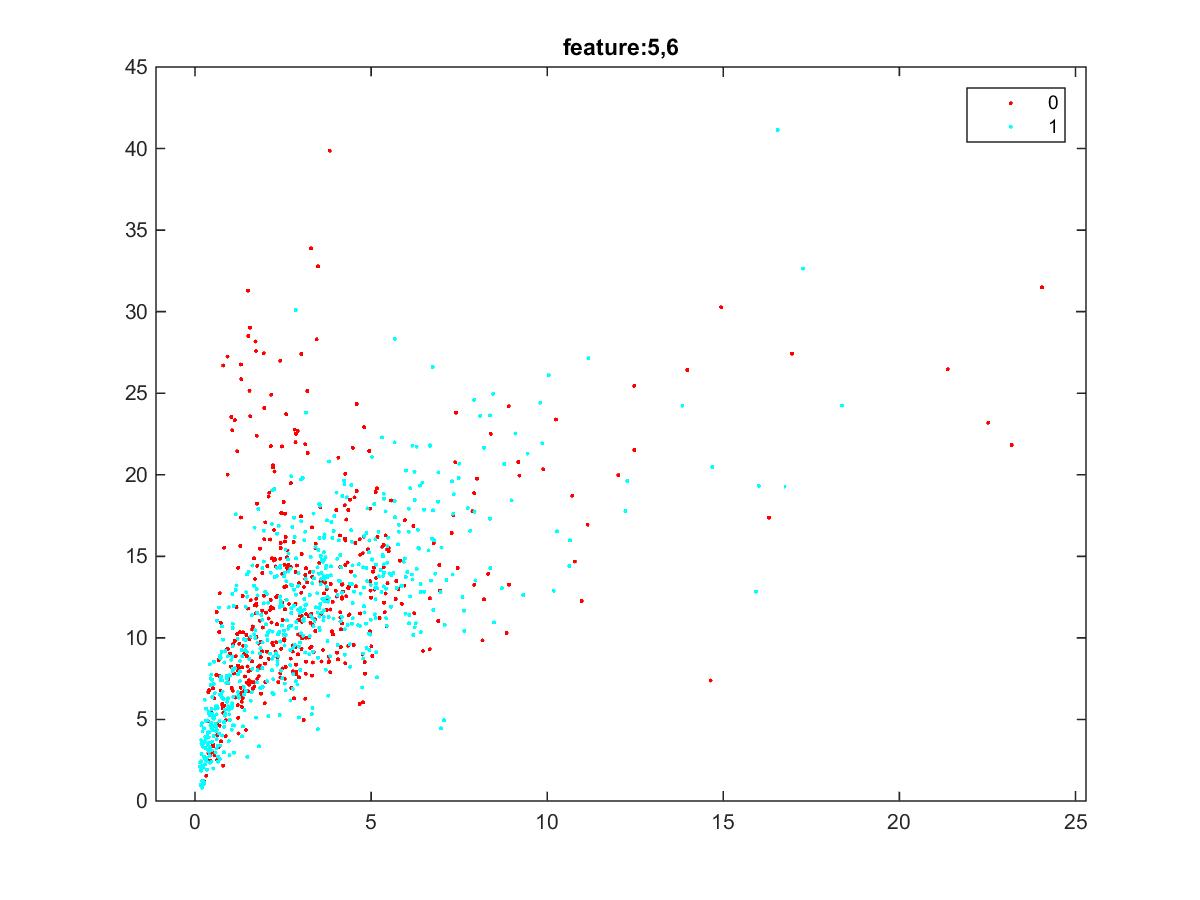
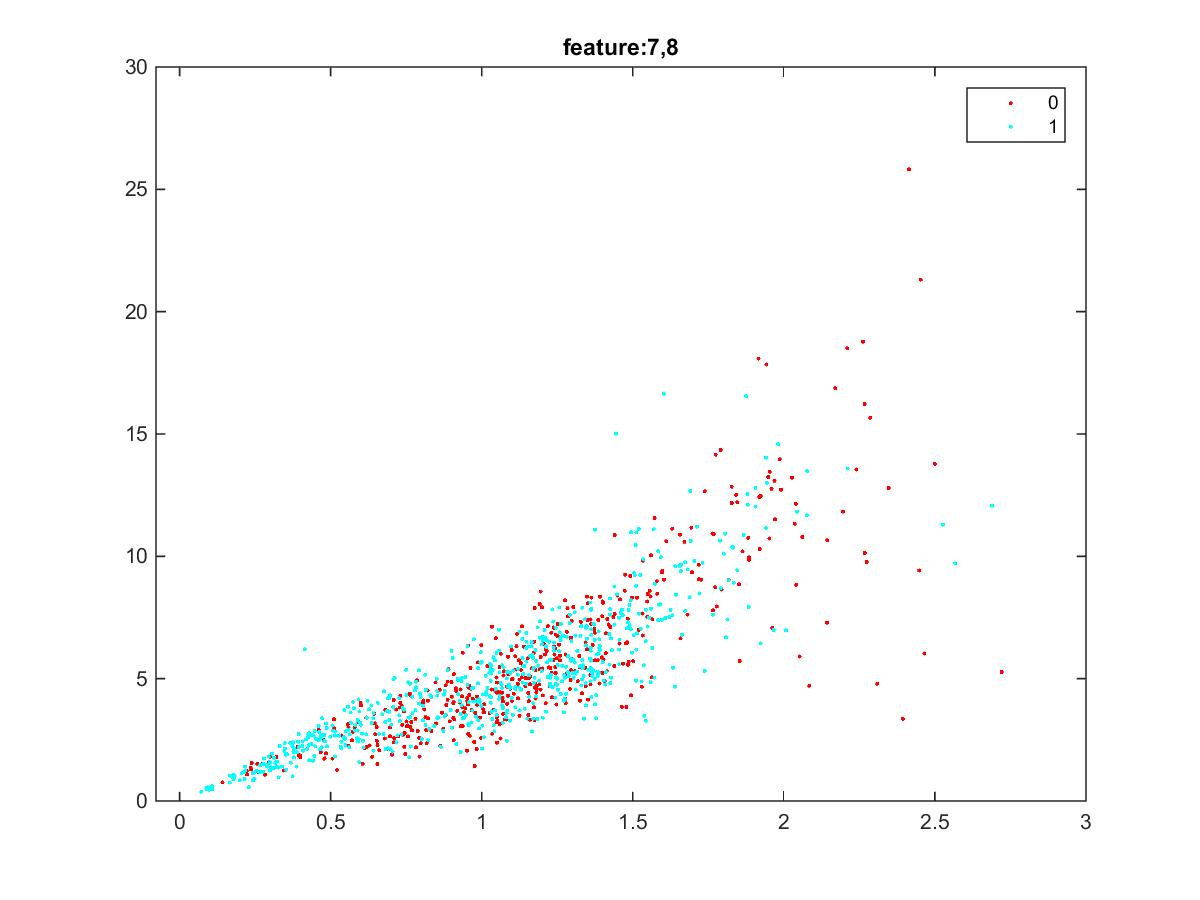
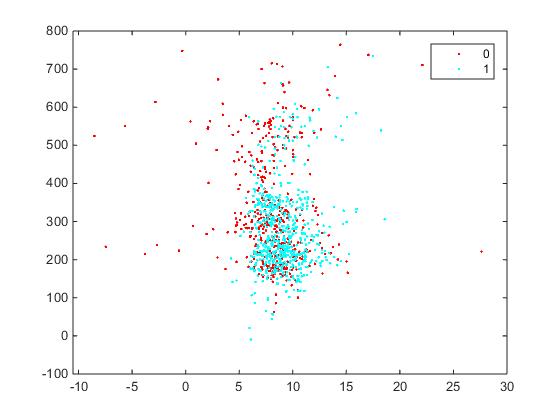
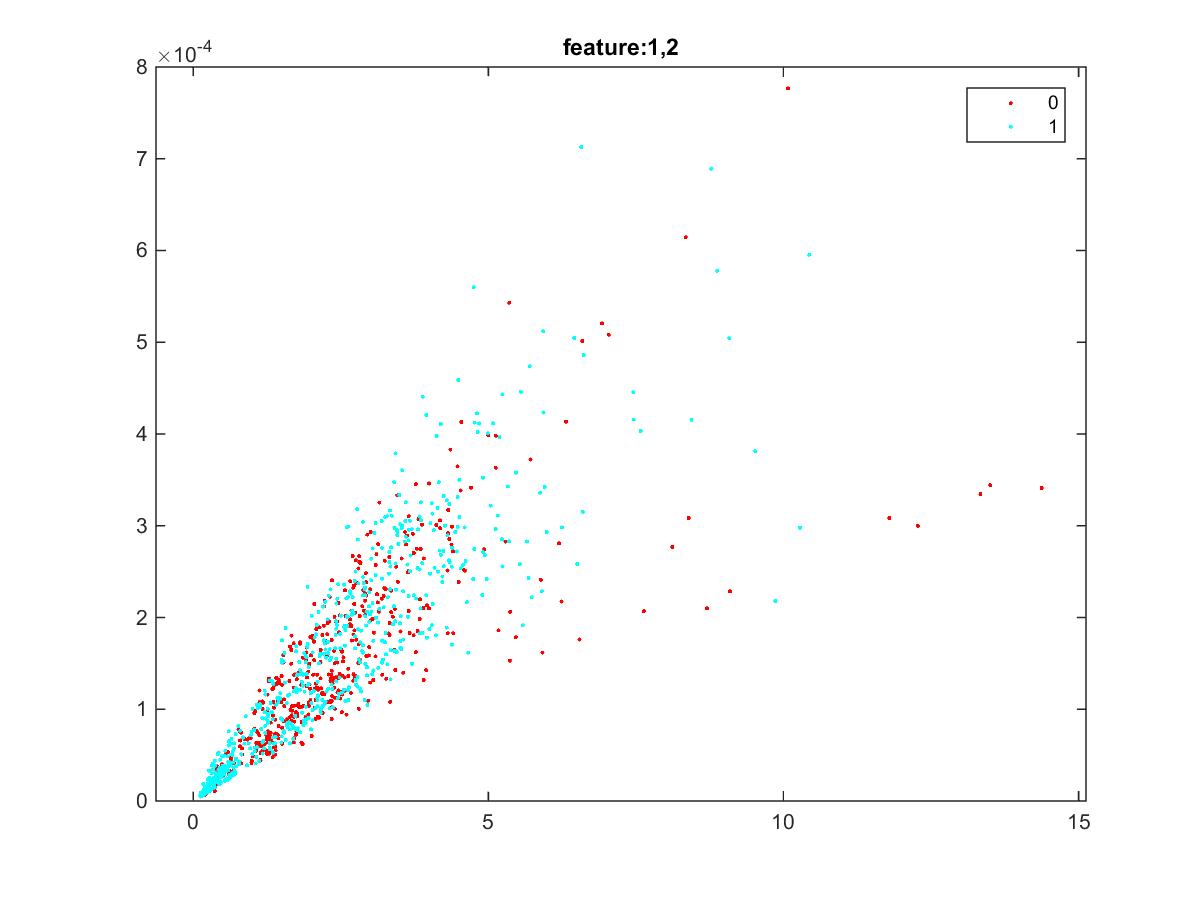
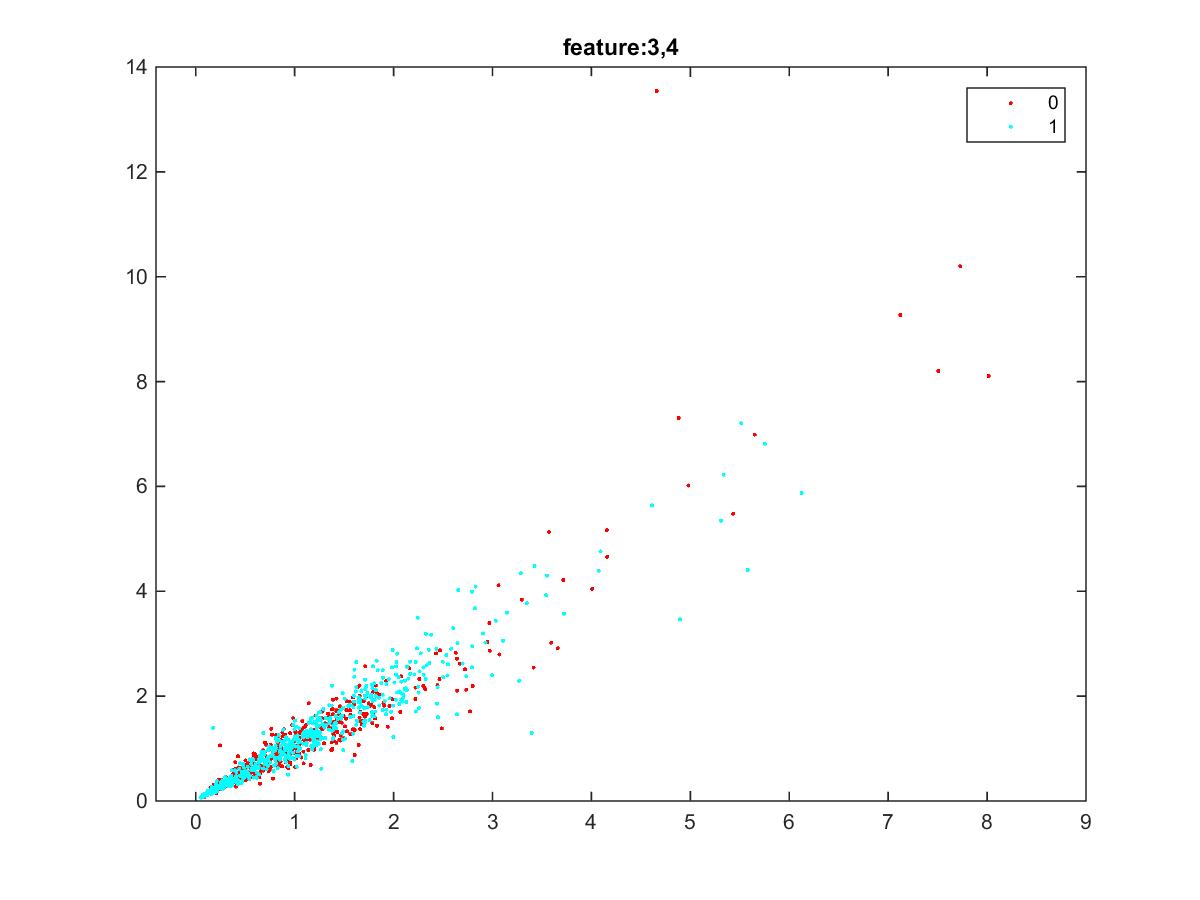
I would like to use the data set Parkinson Speech Dataset with Multiple Types of Sound Recordings Data Set from UCI to test pattern recognition algorithms. However when I plot the features and labels, it seems the features and the label are totally irrelevant. For example, enter image description here enter image description here enter image description here enter image description here

I use K-L Transform, generating a 2D data, but this still does not work well. enter image description here

Are these data from different classes separable?

$\endgroup$
1
  • $\begingroup$ While machine learning is on-topic on Computer Science, there is a more established machine learning community on Cross Validated, so I am migrating this question there in the hope that it'll get more attention. $\endgroup$ Commented May 15, 2015 at 10:48

2 Answers 2

1
$\begingroup$

What you show us is pairwise plots and you have multivariate data. It does not have to be the case that any of the variables individually let you to do accurate predictions, but nevertheless it does not mean that the combinations of variables would not let you to do so.

Check this example, where the corelation changes from positive to groupwise negative when introducing another variable.

In fact, if you look at the paper by Erdogdu et al (2013) that is provided as a reference for this dataset, you'll learn that the authors actually were able to make predictions that were better then random guessing using this data.


Erdogdu Sakar, B., Isenkul, M., Sakar, C.O., Sertbas, A., Gurgen, F., Delil, S., Apaydin, H., Kursun, O. (2013). Collection and Analysis of a Parkinson Speech Dataset with Multiple Types of Sound Recordings.' IEEE Journal of Biomedical and Health Informatics, 17(4), 828-834.
$\endgroup$
0
$\begingroup$

First off, you should use a scatter plot matrix to visualize all features against each other. You'd get some intuition on linear correlations between variables. I'm guessing you did that and couldn't find anything linearly related.

Remember we can always transform the data non-linearly anyway that we would like. Let's build a model that takes in all variables and predicts the label. Afterwards, infer what the model has non-linearly combined and try to make sense out of it.

$\endgroup$

Your Answer

By clicking “Post Your Answer”, you agree to our terms of service and acknowledge you have read our privacy policy.

Not the answer you're looking for? Browse other questions tagged or ask your own question.