You have made a good start. Since the trouble you are having may be due to the randomness involved, let's begin by describing one particular morning during which we observe the worker's actions. According to the problem statement,
$X$ is the rising time (in hours past 6 am), $0 \le X \lt 8-6=2$.
Therefore showering takes place from $X$ to $X+1$.
$Y$ is the departure time (in hours past 6 am), $X+1 \le Y \lt 10-6=4$.
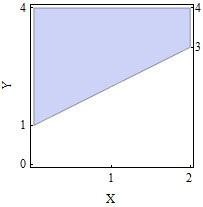
At this juncture it can be useful to sketch, in $(X,Y)$ coordinates, the set of possible joint values of these variables:

Now consider $X$ and $Y$ as random. We need information about the relative likelihoods of the various $(X,Y)$ locations within the shaded area of possibilities. There are two key phrases in the problem statement:
It would be impossible to claim that there is an interval of time from 6am to 8am in which he is more or less likely to get up than any other ...
This is an elliptical way of telling you to assume that $X$ has a uniform distribution. Similarly,
from the time he has showered and prepared to 10 am ,there is no particular time at which the worker is more or less likely to leave than any other
also asserts that something also has a uniform distribution. In terms of the established notation, the time elapsed from the end of showering to departure is given by the interval $[X+1, Y]$. We have been told that all such intervals of this form, from $Y=X+1$ through $Y=4$, are equally likely. In other words, the distribution of $Y$ conditional on $X$ is uniform in the interval $[X+1, 4]$.
(This seems to be the key concept being tested by the question. Make sure you understand why the information you have been given is intended to correspond to this conditional distribution and not to the marginal distribution of $Y$ itself.)
In the figure, the probability model for $(X,Y)$ amounts to choosing a horizontal coordinate $X$ uniformly at random and then, having selected that coordinate, choosing a vertical coordinate $Y$ uniformly at random within the blue area lying above $X$. This visualization of the joint distribution can be a helpful guide to finding the requested density functions.
Looking now at the question itself, it should be apparent that we have been told the answers to the first two bullets:
$f_X(x)$, the marginal PDF of $X$, is the PDF of a uniform distribution on $[0,2]$. Write it down.
$f_{Y|x}(y)$, the conditional PDF of $Y$ given $X=x$, is the PDF of a uniform distribution on $[x+1, 4]$. Write it down. (It depends explicitly on $x$.)
From this information it should be straightforward to compute the joint distribution $f_{X,Y}(x,y)$ from the relationship between $f_X(x), f_{Y|x}(y),$ and $f_{X,Y}(x,y)$. That--finally--gives you full information about the joint distribution of $X$ and $Y$. From it you can easily derive the marginal PDF of $Y$, $f_Y(y)$, by integrating out $x$ from $f_{X,Y}(x,y)dx$.
The question commits a terrible abuse of notation in using the same letter "$f$" for all four distinct functions. Your answers will be four different functions. In particular, it seems to imply that the marginal distributions of $X$ and $Y$ must be the same, because they are both given by the PDF "$f$". That is wrong. I have therefore distinguished the PDFs by suitably mnemonic subscripts. You should do something similar, for otherwise your calculations may become confused.

