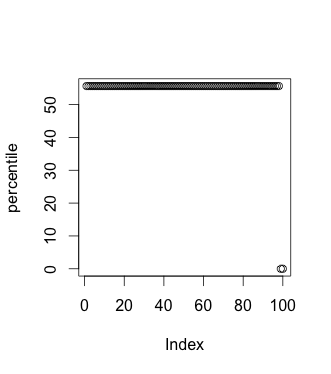
I am dealing with a simple dataset of test scores. It was an easy test -- 98 out of 100 persons got a perfect score. 1 person got a 2% and one person got a 3%.
Here's what it looks like in R:
test_scores <- c(rep(100, 98), 2, 3)
zscores <- scale(test_scores)
percentile <- pnorm(zscores)*100
plot(percentile)

Now, say someone asks, "I got 100%, so what percentile did I score?"
The knee-jerk response should be 100th percentile, but wouldn't it be equally accurate if the answer was anywhere from 3rd to 100th percentile?
Maybe we can consult the plot we produced above -- but wait! According to the y-axis, if you score 100% you are in the 55.6th percentile!
(percentile clearly shows the values)
If this is the case, maybe the answer is, "You got 100% -- you are in the 56th percentile. So anyone who got 100% gets an "F" on this test."
This is an extreme case I cooked up, but it still feels troublesome in lesser incantations. What if you are asked to rank the above test scores in some way like this:
100 - 98 percentile --> "Very Superior",
97 - 90 percentile --> "Superior",
89 - 75 percentile --> "Average",
ad nauseam
You could make an argument that any perfect score could fall into some number of bins.
Is there any reconciliation for this situation? When do you reach the point of 'enough is enough' and throw out classification based on percentiles?
Or, why aren't there some set of assumptions to be employed regarding the distribution of data before percentiles are considered?
