6
$\begingroup$

I'm using the concept of Hedonic regression in order to model the prices for real estates. I'm having some trouble with my approach.

What I have and what I do

  • my data consists out of real estates with following charcteristics: price | livingArea | propertyArea | condoFloorNumber | roomCount | elevator | garage | quiet | etc.
  • I run a robust regression without intercept lmRob(price ~ . -1)

What I want

  • a model with which I can predict the price of real estates, but which are not in the used data set
  • also it would be nice to have some constraints on the coefficients

Problems

  • very often I get bad values for the coefficients ex: bathroomCount = -80000. it's not possible that with a additive bathroom , the price of the house will sink with 80.000€
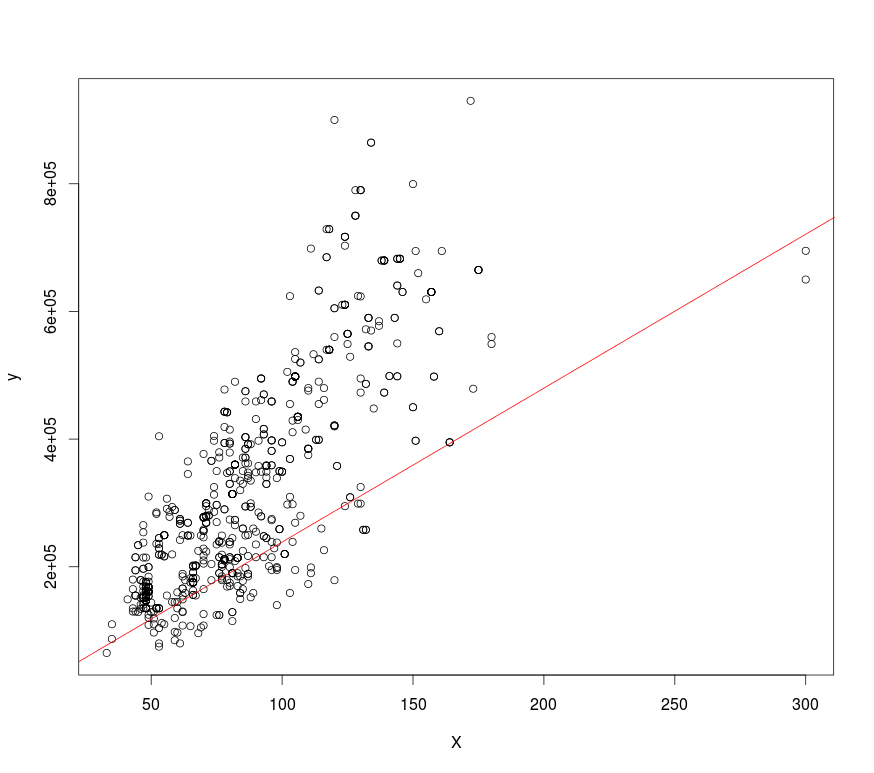
  • also I tried to use the function pcls in order to put some constraints on the coefficients, but this method gave very bad results. In the plot Y = price and X = livingArea. as you can see, the regression line isn't correct. enter image description here
    • another thought was to transform the regression problem into a maximization or minimization problem, but didn't managed to do it
    • also I tried to use different regression methods lm, lmrob, ltsReg, MARS, but they also give me bad coefficients. (sometimes this bad coefficients make a good price estimation)
    • I think that the big number of dummy variables damages a little bit the regression

Is my approach false?

Does someone have some hints, tricks for me? (I'm not a statistician)

[UPDATE]
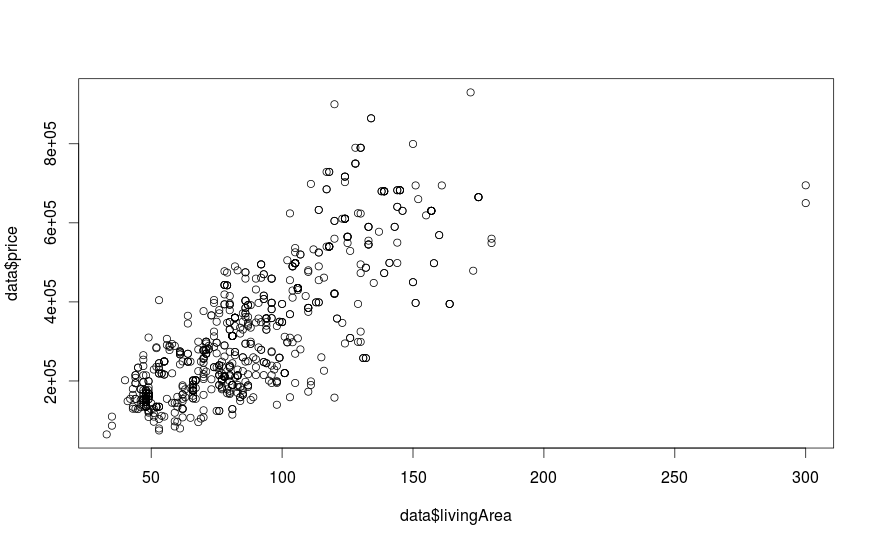
price ~ livingArea

This is how the plotted data looks like. LivingArea is the only non-dummy variable.

[UPDATE 2]

y = bX 

     means

y = b_0*X_0 + b_1*X_1 + ... + b_k*X_k

     which is an equation system like this:

y[0] = b_0*X_0[0] + b_1*X_1[0] + ... + b_k*X_k[0]
.
.
.
y[n] = b_0*X_0[n] + b_1*X_1[n] + ... + b_k*X_k[n]

Did I got it right?

If so, isn't possible to add some inequality constraints equation to it. example:

b_0 >= 2000
b_2 <= b_0/2

[UPDATE 3]

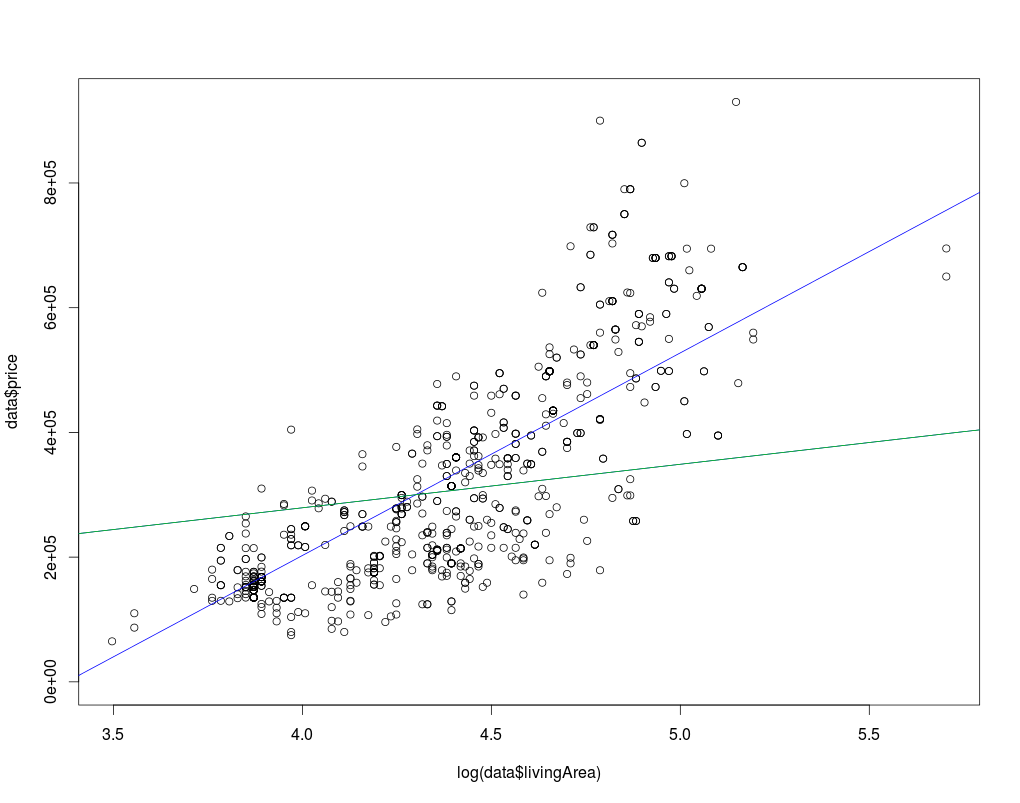
I'm running the regression without intercept, because if all the characteristics of a real estate = 0, then of course it'S price = 0. Nobody would pay for an apartment with 0m². enter image description here but it seems that the regression line where it was used an intercept (blue) looks far more better than the regression line without intercept (green). I can't understand why it is so. and why doesn't the regression line without intercept start at the point (0,0)?
$\endgroup$
10
  • $\begingroup$ You may get into trouble with reliability of predictions if you constrain the coefficients. For predictions, your negative coefficient for number of bathrooms may be helping compensate for over-estimates of values based on its correlated factors alone. With such co-linear predictors you can have a tradeoff between coefficients that "make sense" nominally and a model that actually works for predictions. You have to choose which type of model you want. $\endgroup$
    – EdM
    Commented Jun 15, 2015 at 13:32
  • $\begingroup$ @EdM do you think it would be wise to transform everything in a minimization problem. Trying to minimize the sum of under given constraints? $\endgroup$
    – Paul
    Commented Jun 15, 2015 at 13:55
  • $\begingroup$ Possible, yes. Wise, no. Remember: linear regression, LASSO, ridge regression, etc are all solutions to minimization problems that have been developed over years to address these types of data analyses. Co-linearity can lead to some coefficients that don't make sense when considered individually, but that might be a price to pay for a model that is successfully predictive. $\endgroup$
    – EdM
    Commented Jun 15, 2015 at 14:04
  • $\begingroup$ @EdM in my opinion it is very important that the coefficients make sens also individually. Because if I have two similar real estates, but one of them has an extra bathroom, this means that that one is 80000€ cheaper than the other one. Something like that it's not possible. $\endgroup$
    – Paul
    Commented Jun 16, 2015 at 9:08
  • $\begingroup$ As a partial response to your comparison of regressions with/without intercepts, consider the value of an empty lot in downtown London. No living area, but quite valuable. This is particularly an issue when there are multiple independent variables. Also, with your (wise) choice to log-transform the living area, the point (0,0) now represents 1 unit in the original scale on the x-axis, not 0 units. I suspect that allowing for an intercept will resolve many of your problems. $\endgroup$
    – EdM
    Commented Jun 17, 2015 at 13:55

4 Answers 4

3
$\begingroup$

This type of approach clearly can work (and has evidently been used by tax authorities to set property taxes on my house for many years), so there needs to be some investigation of the sources of this difficulty.

Understanding the nature of this data set is very important. If it is to be used for predicting prices of properties not in the data set you must be very certain that it is adequately representative of the population of properties of interest. It's possible there is some peculiarity in the way this particular sample was collected, so that some particular combinations of co-linear factors are leading to things like the negative coefficients for bathroom numbers. Re-evaluate the sample collection and the data coding, an oft-overlooked source of difficulty. Also, for your PCA-based approaches, the signs of coefficients for principal components depend on the directions of the associated eigenvectors, making it all too easy to create errors when you try to go back to the space of the original factors. Check that, too.

You didn't specify the standard errors of your coefficient estimates, so some of your apparently anomalous coefficients might not be significantly different from 0. For example, a -80K coefficient per bathroom with a standard error of +/- 100K would not really be an issue; that probably just means that the high co-linearity makes it difficult to determine a value per bathroom, given its high association with land area, numbers of bedrooms, and so forth. If that's the case you should retain the coefficient when making predictions, as the apparently anomalous coefficient for bathrooms is probably helping to correct for price over-estimates based on some of its co-linear factors alone.

You could try to figure out which combinations of factors are leading to these problems. Although stepwise selection of factors is not wise for building a final model, for troubleshooting you might consider starting with a simple model of price-bathroom relations and adding more factors to see which combinations of factors are leading to your problem.

You also should take advantage of information from structured re-sampling of your data set to evaluate these issues. You don't say whether or how you have approached this crucial aspect of model validation. If you have, then cross-validation or bootstrap resampling may have already provided insights into the sources of your difficulty. If you haven't, consult An Introduction to Statistical Learning or similar references to see how to proceed.

$\endgroup$
4
  • $\begingroup$ I'm gathering the data in the following way: lets say I want to evaluate the real estate A, which is an apartment for sale. I will use in the regression all apartments for sale which are in a radius of 6km. I'm doing the regression automatically (Java calls R), so I can't look at the data. But I'm validating the data by removing outlieres and also variables with high correlation. $\endgroup$
    – Paul
    Commented Jun 15, 2015 at 6:42
  • $\begingroup$ So it is a sort of geographically weighted regression. Some colleagues and I did some work on multicollinearity on this setting, you might want to look BÁRCENA, M.J., MENÉNDEZ, P., PALACIOS, M.B. Y TUSELL, F. (2014) Alleviating the effect of collinearity in geographically weighted regression (GWR), Journal of Geographical Systems, vol. 16, 441-466. $\endgroup$
    – F. Tusell
    Commented Jun 15, 2015 at 7:34
  • $\begingroup$ @F.Tusell: yes, it is a geographically weighted regression. But it must be with constraints on the coeffcients. $\endgroup$
    – Paul
    Commented Jun 15, 2015 at 7:45
  • $\begingroup$ Removing "outliers" and variables with high correlation is not the same as model validation. It's not just validating input data; it's also testing the suitability of the statistical model. Validation of the model requires checking the model-building process with your data. Separate training and validation sets of data are a minimum; examining the model-building process repeatedly with cross-validation or bootstrap resampling is better. If you do not validate your model you are asking for trouble in practice. "An Introduction to Statistical Learning," linked above, is freely available. $\endgroup$
    – EdM
    Commented Jun 15, 2015 at 13:21
2
$\begingroup$

I know this is an old post; hope the message helps someone reading this thread who might approach the same problem. The logical premise that 0 rooms; and 0 living area = zero value is improper because what the model is ignoring is the underlying value of land. This also affects the "geographic" dispersion characteristics because exactly equal home sizes; baths; beds, living area etc will still show value differences correlated to location (and underlying land value) - but as house gets old, smaller, etc - the value will converge at land value; not at zero.

$\endgroup$
1
$\begingroup$

I think your last remark ("I think that the big number of dummy variables damages a little bit the regression") is spot on. The very anormal values you observe for some regession coefficients clearly points to multicollinearity. You might want to try ridge regression or principal components regression.

$\endgroup$
15
  • $\begingroup$ I found a big correlation between roomCount and bathroomCount. But from business view, I can't remove one of them, because we know that a large roomCount and a small bathroomCount is something bad. eg 10 rooms and 1 bathroom. $\endgroup$
    – Paul
    Commented Jun 12, 2015 at 10:46
  • $\begingroup$ I just tried principal components regression but sadly the coeficients are really bad. for example elevator = -16290.177, cableTV = -27897.14. $\endgroup$
    – Paul
    Commented Jun 12, 2015 at 11:11
  • $\begingroup$ sadly the same problem with the ridge regression. I get some bad values for the coefficients, values which do not make any sense, but the prediction using the coefficients is relatively good. $\endgroup$
    – Paul
    Commented Jun 12, 2015 at 11:23
  • $\begingroup$ Did you drop the principal components with low eigenvalue associated? $\endgroup$
    – F. Tusell
    Commented Jun 12, 2015 at 12:53
  • 2
    $\begingroup$ Then, I am at a loss. No easy to diagnose without looking at the data and detailed output. $\endgroup$
    – F. Tusell
    Commented Jun 12, 2015 at 13:11
1
$\begingroup$
  1. Use intercept in your model. This is very strong assumption, that when all variables would equal 0, then predicted price should be zero and it is not required, especially, that such a real estate would not appear in a train or test data set. Even if it is true, that real estate with all characteristics equal to zero should have price equal to zero, it require assumption, that your model control all factors of estate price, which is rather false. If you think it is so obvious that only real estate with all characteristics equal to zero should have price equal to zero, how much would you pay for real estate with 5m squared area? Because I would still be able to pay zero dollars for such an estate. Am I unreasonable or this assumption is unreasonable?

  2. Use semi-logarithmic regression, that is predict logarithm of dependant variable. When you use normal linear regression, it is like assuming, that total value of estate is equal to sum of value of every single characteristic. This can be wrong assumption. I think, that for example, if estate is in quiet area it increases the value of estate by x%, let's say by 30%, no by x\$, not by certain fixed amount of dollars. That is however, what your model is assuming. It is unreasonable to assume, that values of two estates, that one of them have 100 m and second have 10000 m would be increased by the same amount of dollars, let's say by 10000$. It rather would be increased by certain percentage. Use semi-logarithmic model, by that your model will assume, that final value of estate can be reduced to multiplication of every of its properties. It usually works better in such a situations, and it is standard way of proceeding in real estate value model (look in literature, don't try to invent a wheel).

  3. Try to add other terms to your model: for example squares of variables and their interactions.

  4. Investigate outliers. At least two points looks like outliers, try to figure out what they are, and why they have strange variable values. Maybe you can find error in this data or you can add some feature or interactions to capture such cases.

$\endgroup$

Your Answer

By clicking “Post Your Answer”, you agree to our terms of service and acknowledge you have read our privacy policy.

Not the answer you're looking for? Browse other questions tagged or ask your own question.