1
$\begingroup$

I would like help understanding why a survival regression with no censored data-points does not give the same variance estimates as a linear model (see code below).

I think it must be something to do with the fact that the variance is an actual parameter in the survival version via the log(scale), and possibly that different assumptions are made about the distribution of the variance. But I really don't know, I'm just guessing.

The reason I ask is because I am moving a process, that has always been modelled using a linear model, to a survival model (because there are sometimes a few censored data points). In the past, the censored data points have been treated as missing which imparts bias. The variance of the estimates in this process is key, so I need to know why they are changing in this systematic way?!

library(survival)

ctl <- c(4.17,5.58,5.18,6.11,4.50,4.61,5.17,4.53,5.33,5.14)
ctl.surv <- Surv(ctl)

trt <- c(4.81,4.17,4.41,3.59,5.87,3.83,6.03,4.89,4.32,4.69)

lmod <- lm     (ctl      ~ trt                )
smod <- survreg(ctl.surv ~ trt,dist="gaussian")

coef(lmod)
coef(smod) # same

vcov(lmod)
vcov(smod) # smod is smaller

diag(vcov(lmod))     /
diag(vcov(smod))[1:2]  # 1.25 == 0.5*(n/(n-1))

( summary(lmod)$coef [   ,"Std. Error"] /
      summary(smod)$table[1:2,"Std. Error"]   )^2    # 1.25 = 0.5*(n/(n-1))
$\endgroup$

2 Answers 2

1
$\begingroup$

The difference between the two models is essentially due to maximum likelihood estimates of $\sigma$ (survreg) vs. unbiased estimates (lm).

In particular, lm uses the unbiased estimator $\hat s = \frac{\hat \sigma \sqrt n}{\sqrt{(n-k)}}$, where $\hat \sigma$ is the MLE and $k$ is the number of mean parameters estimated.

On the other hand, survreg uses the MLE estimate of $\sigma$. As far as I know, there is little choice in this matter; I'm not aware of an unbiased estimator for $\sigma$ in the case on censored data.

$\endgroup$
0
$\begingroup$

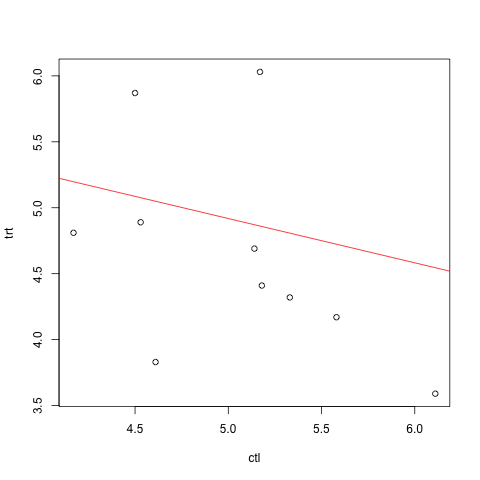
The lm-function would estimate the line where trt was the x-predictor and ctl was the y-outcome:

png(); plot(trt ~ ctl) abline(lmod <- lm (ctl ~ trt ), col='red') dev.off()

enter image description here

The survreg-function would order the times in Surv() and use the number of "surviving" cases as a denominator to estimate hazard rates as a function of trt values (which would appear to make very little sense.). I cannot understand why you think these should deliver similar results.

$\endgroup$
6
  • $\begingroup$ They will (and do) give similar results because the distribution assumed in the survival model is Gaussian and none of the observations are censored. It is the same model, however the method of estimation is different. If you take the above code and increase the sample size, they will asymptotically reach the same parameter estimates $\endgroup$
    – sqrt
    Commented Sep 1, 2015 at 20:02
  • $\begingroup$ The data make it appear that you are examining two different groups (trt and ctl) and measuring a time value for the individual units in each group. That was the basis for my concern that neither lm((ctl ~ trt ) nor smod <- survreg(ctl.surv ~ trt,dist="gaussian") appeared to be an appropriate model. If you wnat good statistical advice you will need to describe the data gathering process and the goals of hte study better. $\endgroup$
    – DWin
    Commented Sep 1, 2015 at 21:38
  • $\begingroup$ Apologies for the dataset choice, it does seem that I am comparing control and treatment groups. You could imagine a case where there is a chance that only the treatment group observations were censored therefore this model could be appropriate. In actual fact, the data gathering process was just using the ?lm example dataset in R as I thought people would be familiar with it. $\endgroup$
    – sqrt
    Commented Sep 2, 2015 at 6:02
  • $\begingroup$ @sqrt: Do you now understand why neither lm nor survreg models you proposed have a meaningful interpretation? Both are regression models where you might compare those two sets of times by a factor covariate. It's completely wrong to use the trt-vector as a covariate.. $\endgroup$
    – DWin
    Commented Sep 2, 2015 at 6:10
  • $\begingroup$ No I don't understand. The variable names were taken from a standard R example and do not correspond to control and treatment. However, it is possible to imagine a crossover study giving data like this. It is also possible to imagine that one of the measurements (in this case: treated) can sometimes be censored and a model such as this might be appropriate. Note that the response for a survival model does not need to represent time, it can be anything with any type of censoring $\endgroup$
    – sqrt
    Commented Sep 2, 2015 at 7:36

Your Answer

By clicking “Post Your Answer”, you agree to our terms of service and acknowledge you have read our privacy policy.

Not the answer you're looking for? Browse other questions tagged or ask your own question.