Imagine I have a set of (xi,yi) measures.
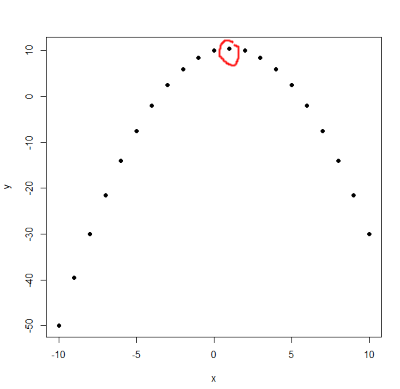
I can show it on a scatter plot

I want to choose the value of x that maximizes y, or I could fit a function and find the values of the parameters that maximize that function.
To put it simple I decide to fit a general linear regression model (quadratic on the variable) Y=a+bx+cx^2. I can do it with R, using the glm() funtcion. And I would get the values of a, b, c their standard errors SE(a), SE(b), SE(c), R2 and more things.
And the max would be located at x=-b/2c
My question is, How can I calculate the confidence interval for that x, the predictor? Is it just the typical formula x+-Z·S/sqrt(n)? and using some result provided by R for that S? or do I need to calculate that standard using a more complex methods, such as the square root of the sum of derivatives squared...? Or it's something completly different?
How would you do it with a simulation with x ? maybe calculate "y" for different values of x with perturbation. then choose the 95% max values of y (??) and calculate the confidence interval for the associated x's ? How would you do it?

