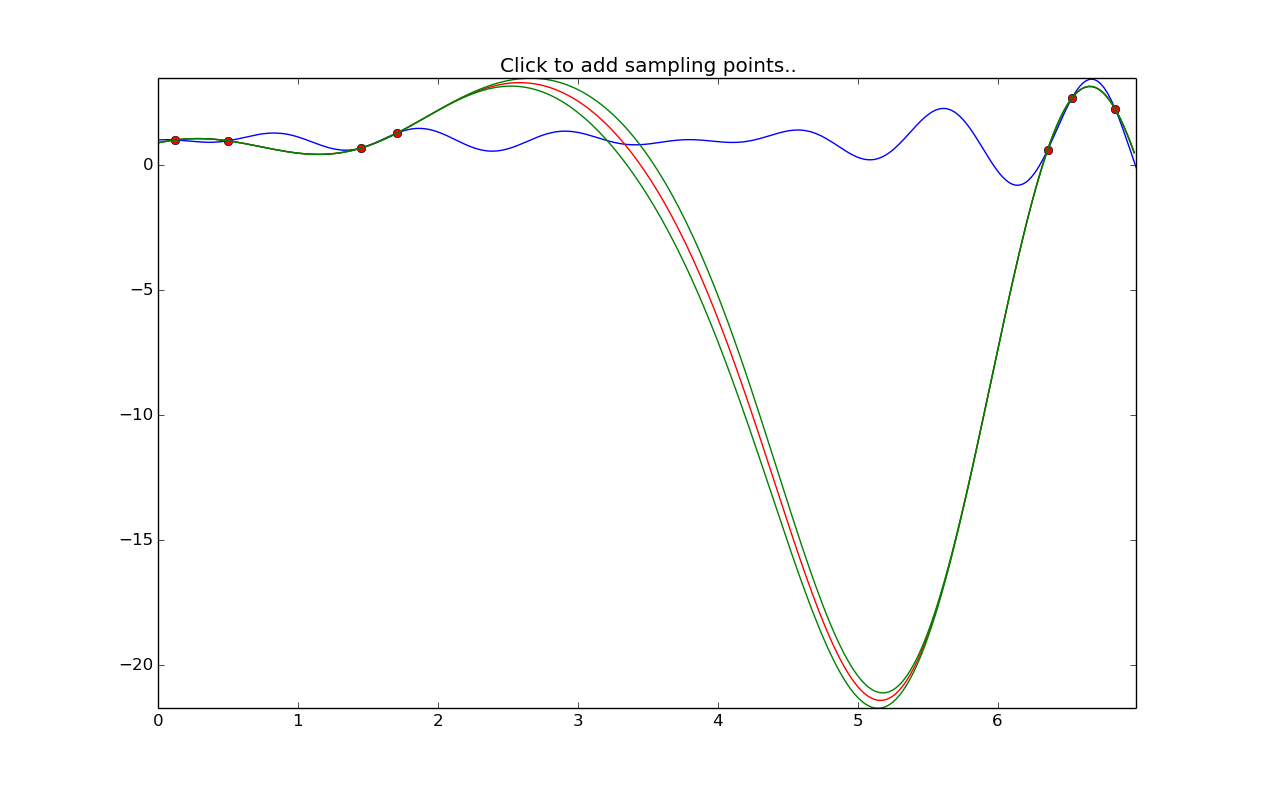
In my opinion, there is a huge problem here, because according to Bayesian optimization approach (as I understand it), samples are supposed to be taken from GP with prior constant mean (near zero).
And here I see posterior mean far from zero. It is very unlikely that this mean was taken from prior GP with near-zero constant mean. Changing covariance parameters doesn't help, I didn't see any effect at all. Noise is zero.
My understanding is that either MOE has a constant prior mean or the users supplies a constant prior mean (that is, $\mu\sim\mathcal{N}(c,\sigma^2),$ for some constant $c$, as opposed to the prior on the mean $\mu$ being some sort of function such as $\mu\sim\mathcal{N}(X\beta,\sigma^2)$ for some predictors $X$ and coefficients $\beta$). But this is just the prior. Simultaneously estimating the posterior GP parameters and the posterior mean parameters will shift both of these, so there's no reason to believe that the posterior will lie anywhere near zero.
What's probably happened here is that the model has found some solution to estimating the GP parameters such that the posterior mean is far from zero (say, $\mu=-10$), and the effect of the covariance parameters is to bring the posterior predictions in line with your observed data points. I'm not sure what estimation procedure you used for this model, but there's no guarantee that the likelihood of a GP mdoel does not suffer from multiple local maxima; that is, it's possible that there is an equally good (or even better!) model in terms of its likelihood, so this solution is just one among many (Rasmussen and Williams, Guassian Processes for Machine Learning, page 115). One of these alternative models may have a different combination of mean and covariance parameters such that the posterior mean is closer to all of your data points.
One solution to this indeterminacy is Bayeisan GP inference: taking a posterior distribution over all GP parameter estimates, the analyst effectively takes a weighted average over alternative GP models, with the weighting corresponding to its posterior probability. More information can be found in Gelman, Bayesian Data Analysis, 3rd ed., which has an entire chapter on Bayesian GP inference.
While it's the GP model is so quite far from your actual model in that middle region, I believe that's almost entirely the effect of not having any sample values in that interval. When you sample a point in there and re-estimate the GP parameters, your posterior predictive function should stick much closer to your function points. The general point here is that having more data will permit better model predictions, and that those predictions will tend to be better the closer they are to sample points!
I'm not sure what method you've used to generate these sample points, but I believe MOE implements EGO (Jones, "Efficient Global Optimization of Expensive Black-Box Functions," Journal of Global Optimization, 1998) for parameter estimation, which is highly regarded as a global optimization algorithm. If your goal is to optimize an arbitrary function, you could do much worse than using EGO.

