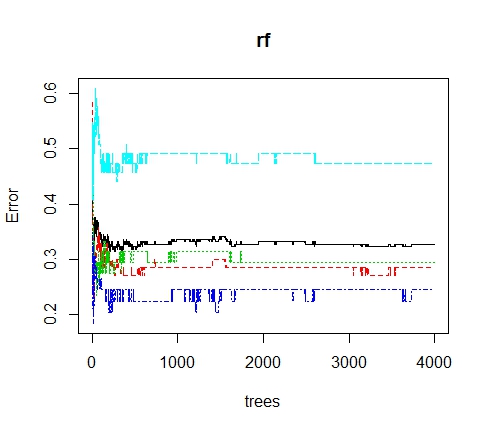
When I run random forest in R package and use plot function, there have many curves including out of bag error rate curve (black colour) and the misclassification error rate curves (other colours). However, I only would like to show on the plot only the out of bag error rate curve. How can I do that?
2 Answers
The curves can be subsetted using the $ symbol in R.
So, this is how you single out the error rate curve.
$err.rate
You might also want to look at the documentation of the random forest plot by: (?plot.randomForest)
-
$\begingroup$ How would you plot the
err.ratethen?plot(someModel$err.rate)does not do the trick $\endgroup$ Commented Sep 5, 2016 at 12:48
More in detail:
Your confusion Matrix contains a variable, called err.rate which you access with the $ sign. The err.rate is stored as a matrix where the first column is the OOB Error. Each class gets its own column. Try str(someModel$err.rate).
To access the err.rate do this $err.rate[,1], for plotting simply plot(myModel $err.rate[,1]).
The other columns in your matrix are the error rates of your classes!

