2
$\begingroup$

I'm using the GAP statistics (clusGAP) to find the optimal number of clusters in my gene expression data. But I'm not sure whether the optimal number suggested by clusGAP is right or not. I ran the clusGAP for several times (clustGAP(data, kmeans, K.max = 30, B = 100)), but I received different results as follow: Suggested number of cluster is 11
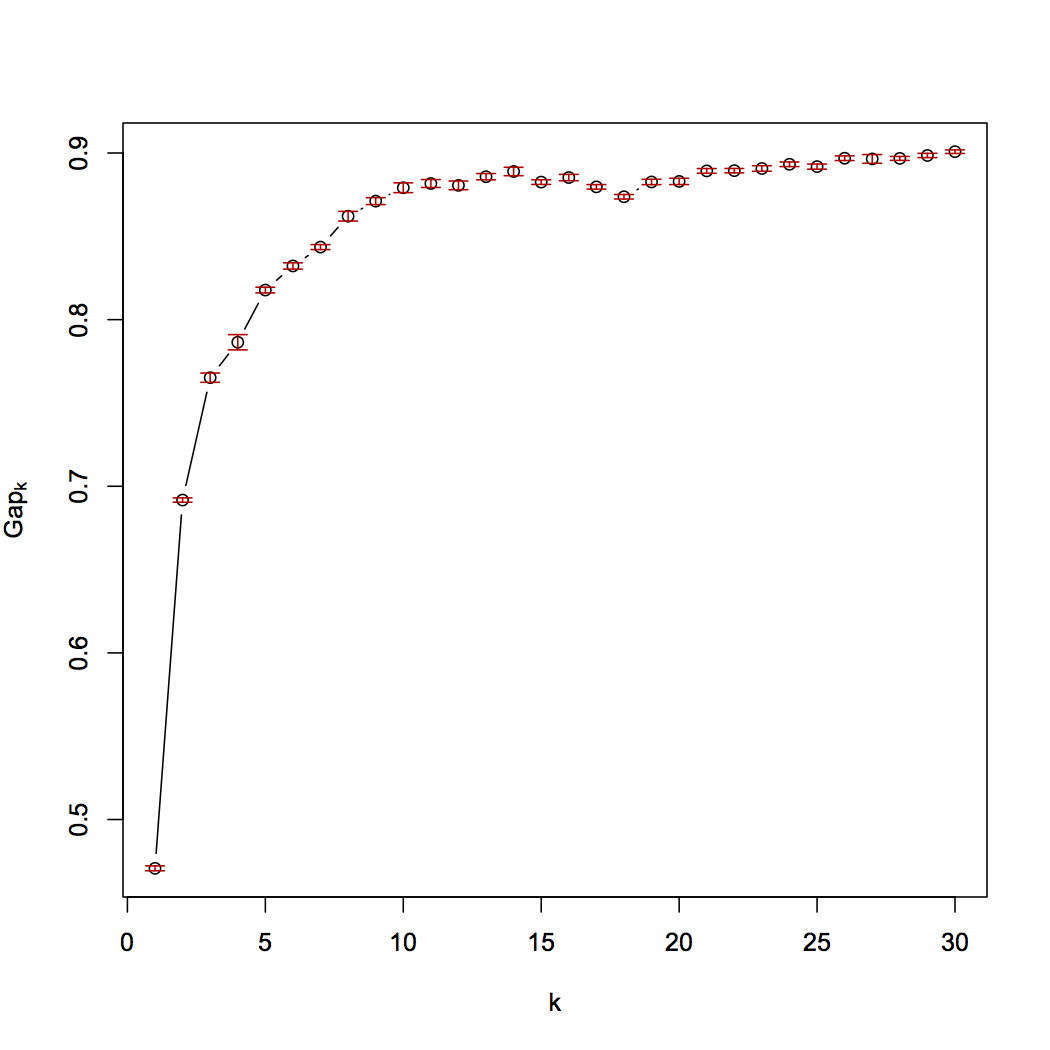
The suggested number of cluster is 11 for above figure ("firstSEmax");

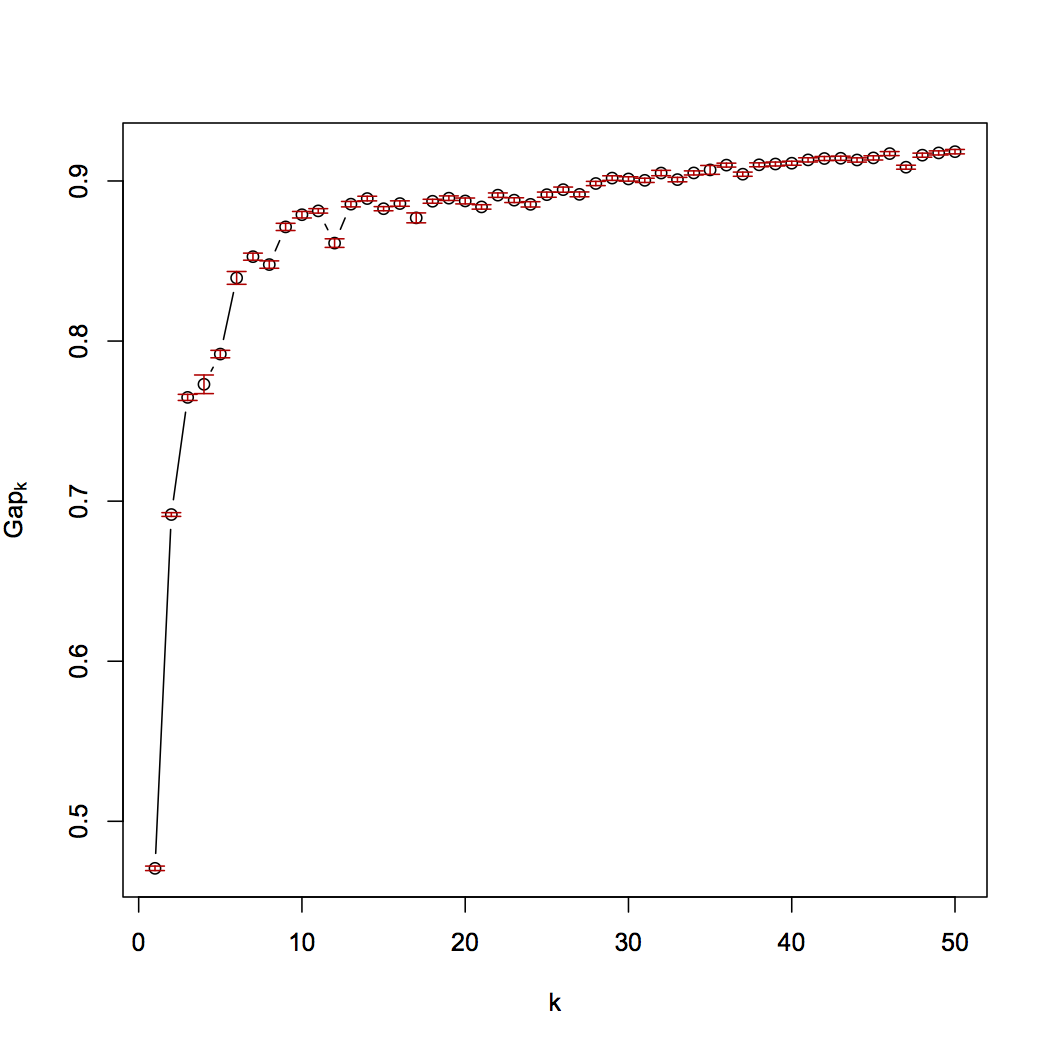
For another trial, Suggested number of cluster is 11

The suggested number of cluster is 7 for above figure ("firstSEmax");

So I have two questions here:

  1. I thought in these results, it is hard to find the maximum of Gap value compared to the examples in the original paper. I'm new in this field, so I don't know whether I can believe the optimal number of clusters suggested by the clustGAP?

  2. As I mentioned, the optimal number is different in different trials, then the question is which one to choose? or how can I get a consistent result?

$\endgroup$
7
  • 1
    $\begingroup$ possible duplicate of Why does gap statistic for k-means suggest one cluster, even though there are obviously two of them? $\endgroup$ Commented Sep 15, 2015 at 17:12
  • $\begingroup$ Are you able to visualise your data in some way? Do eleven clusters make any sense? Do seven? Is there anything fundamentally different between the different trials? In the thread mentioned by @Anony-Mousse, I link against the original paper of the GAP statistic; it is not overly technical, try to give it a quick read to get a better idea of the theory behind this statistic. $\endgroup$
    – usεr11852
    Commented Sep 15, 2015 at 18:41
  • 1
    $\begingroup$ @Anony-Mousse: While the first question is mostly addressed by the link you give (so I would be inclined to close this as a duplicate) the second question is not covered there and it has utility on its own right. $\endgroup$
    – usεr11852
    Commented Sep 15, 2015 at 18:43
  • $\begingroup$ That variation is probably an artifact of k-means being randomized (and not returning stable results; common with badly normalized data). It may well go away, when 1) is resolved. $\endgroup$ Commented Sep 15, 2015 at 19:07
  • $\begingroup$ @usεr11852 I also used HCA and visualize it in JavaTreeView. At certain cutoff, I actually could identify 16 different clusters. However, 7-means result also make sense. I think it is because the other clusters are not big. $\endgroup$ Commented Sep 15, 2015 at 19:46

1 Answer 1

2
$\begingroup$

I do not trust the Gap statistic, or any of these heuristics. In particularly not if the plots are as smooth as these.

Please try to visualize your data. Make sure you have preprocessed it well enough. In all the similar questions here (try searching for "gap statistic") I had the impression that either the data was not well preprocessed, or just doesn't contain clusters at all...

This answer: https://stats.stackexchange.com/a/140723/7828 is a great example on why I (A) do not trust the gap statistic, (B) preprocessing is really really really important, (C) visualization is helpful.

Really visualizing your data is worth all the effort. In particular, also visualize the "best" result. Does it look good to you, or anomalous? Instead of trusting on some debated statistic like the Gap statistic, it is much better to trust a good visualization.

$\endgroup$

Your Answer

By clicking “Post Your Answer”, you agree to our terms of service and acknowledge you have read our privacy policy.

Not the answer you're looking for? Browse other questions tagged or ask your own question.