3
$\begingroup$

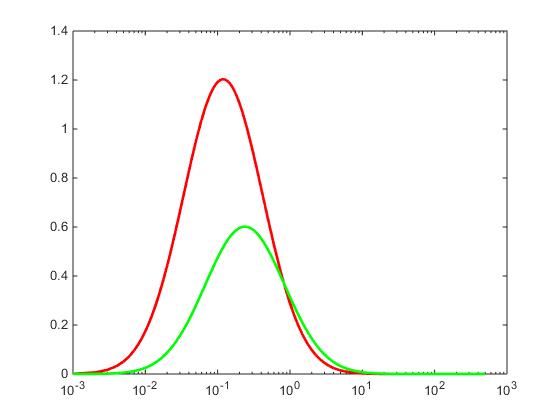
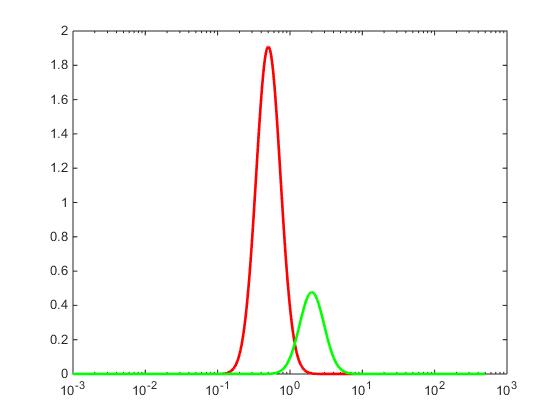
I am trying to determine a metric that quantifies the distance between two continuous lognormal distributions. The data is actually a mixture of two lognormal distributions (I am not sure if this can be called bimodal). The individual distributions have different means but the same standard deviations. I have 20 data sets that can be divided into 4 groups, with each group having a constant standard deviation, but the 5 data sets in each group are made up of two distributions with different means. Some examples:

enter image description here

enter image description here

I am in search of a metric that accounts for the contrast (difference in means) and the standard deviation. I have tried out some parameters like coefficient of variation (of the mixture), Ashman's D etc. I have also tried percentage of overlap. However the problem always is that, at the end when plotted against the results I end up with 4 trend-lines again, corresponding to the 4 different standard deviations. Is there some other way I can quantify this?

Just to make myself clear, I want to quantify the difference between two distributions in a single case (between the red and green PDFs in the above image).

$\endgroup$
1

3 Answers 3

2
$\begingroup$

For what purpose do you need the distance? For some purposes, like hypothesis testing or discrimination, the kullback-Leibler divergence is useful, as it really gives the expected value of the likelihood ratio statistic, see Intuition on the Kullback-Leibler (KL) Divergence

An expression for that distance in the lognormal (and a lot of other cases) can be found at http://www.mast.queensu.ca/~linder/pdf/GiAlLi13.pdf

I give the expression for the lognormal case below (from above paper): $$ D(f_i||f_j)= \frac1{2\sigma_j^2}\left[(\mu_i-\mu_j)^2+\sigma_i^2-\sigma_j^2\right] + \ln \frac{\sigma_j}{\sigma_i} $$

$\endgroup$
1
$\begingroup$

You might consider Kolmogorov–Smirnov test, specifically the two sample K-S test

$\endgroup$
1
  • $\begingroup$ I tried the two sample KS test in Matlab. The h and p values are not of use as such. I was hoping the test statistic could be used as a metric. However in cases where the two distributions are apart and there is no overlap, the statistic is one which leaves me with atleast 7 cases collapsing to one point on the graph ( I am plotting a result: cells invaded in a model built using the two grain size distributions in a particular case versus the test statistic of that case). Are are there any other techniques I can use. $\endgroup$
    – pgkrish
    Commented Sep 21, 2015 at 18:39
1
$\begingroup$

I had the same problem and found a neat solution. Try the Bhattacharyya distance, read up on it on wiki and use the formula described there (links below). Of course, the lognormal gaussian distributions can't be directly used so you have to transform the X-values to Log(x). This doesn't matter. It yields a good measure of the difference between distributions using the mean and variance of a normal distribution. However, it doesn't give you any indication of significance. Use a gaussian regression on your transformed data to obtain µ and sigma. A Bhattacharyya distance of 0 means no difference and higher values means larger difference. Alternatively, you could use the Bhattacharyya coefficient which is 10^-(Bhattacharyya distance) that yields a number between 0 and 1, where 1 is absolute overlap and 0 is absolute difference.

However, it needs context for interpretation, but can greatly reduce the amount of space needed to explain your results. I also tried the Kolmogorov-smirnov, but that didn't quite float my boat.

Example

Set 1
Peak 1 Peak 2

sigma 0,3628 0,3026

Mean 6,424 4,629

Bhattacharya coeff. 0,000241415

Set 2
Peak 1 Peak 3

sigma 0,3628 0,1692

Mean 6,424 5,397

Bhattacharya coeff. 0,016648291

Set 3
Peak 1 Peak 1

sigma 0,3628 0,3628

Mean 6,424 6,424

Bhattacharya coeff. 1

https://en.wikipedia.org/wiki/Bhattacharyya_distance

https://wikimedia.org/api/rest_v1/media/math/render/svg/47be73b3efbd143c80761df6ce87f3ee095e03d6

$\endgroup$
1
  • $\begingroup$ It is not clear how this answers the question. $\endgroup$ Commented Jun 13, 2017 at 14:50

Your Answer

By clicking “Post Your Answer”, you agree to our terms of service and acknowledge you have read our privacy policy.

Not the answer you're looking for? Browse other questions tagged or ask your own question.