4
$\begingroup$

I have results (weights) for multiple runs of self organizing map. I am trying to compare these results to check if my algorithm gets to the same solution from different random initial weights. I have looked online but couldn't find any good method for this, any suggestions or helpful link will be appreciated.

Effort made; Compute distances of all SOMS against each other in MATLAB..(got stuck with a big matrix of distances), this doesn't seem right to me, i believe there should be a formal and better way out there.

This can also be applied to K-means. Weights are same as Centroids.

$\endgroup$
3
  • 1
    $\begingroup$ I'm not familiar with SOMs, but since you bring up k-means, a common approach is to train them until weights to see if they're within a particular tolerance. Does this fit your interest? If so, I can write up a full answer. $\endgroup$ Commented Dec 10, 2015 at 19:12
  • $\begingroup$ Thanks @SeanEaster yes let's pretend it is k-means as the results are all the same; (centroids). I have done the training bit, now i'm not sure on how to go about examining if they're within a particular tolerance kindly advice. $\endgroup$ Commented Dec 14, 2015 at 21:46
  • $\begingroup$ If you find the same centroids I guess all of them found the same local minimum $\endgroup$
    – Simone
    Commented Dec 14, 2015 at 23:18

1 Answer 1

4
$\begingroup$

First of all, if you want to use R language, there is a very useful package (actually not only one) to do your analyses: "kohonen". The most simple function for unsupervised Self Organizing Maps (I think it's your case) is "som". Now suppose your trained som is called mySom.

That said, comparing the sum (or average) of the distances of inputs from the related centroids is a good way to say if two soms have a similar quality:

index <- mean(mySom$distances)

In order to see if they produce similar results you should see the how the codebooks (vectors) are similar from a SOM to another (mySom$codes). I think you could make the average difference between codebooks.

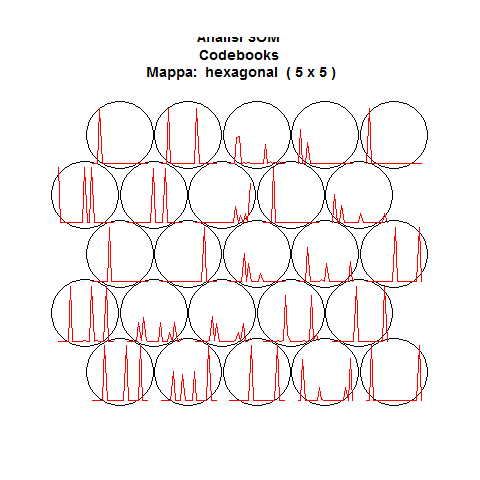
The "final" way is to see the distributions inside the codebooks.

enter image description here

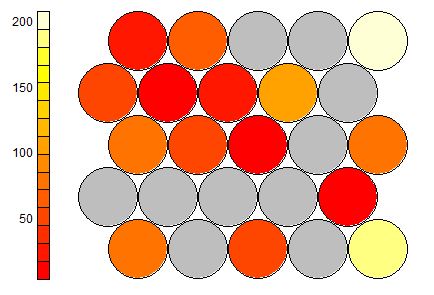
Using the parameter type inside the plot function you can represent the SOM is many ways. The most useful are: type = "mapping", "property". enter image description here

$\endgroup$

Your Answer

By clicking “Post Your Answer”, you agree to our terms of service and acknowledge you have read our privacy policy.

Not the answer you're looking for? Browse other questions tagged or ask your own question.