I need suggestion about data visualisation for cross validated data.
I want to plot data after cross validation and need suggestions how to do that?
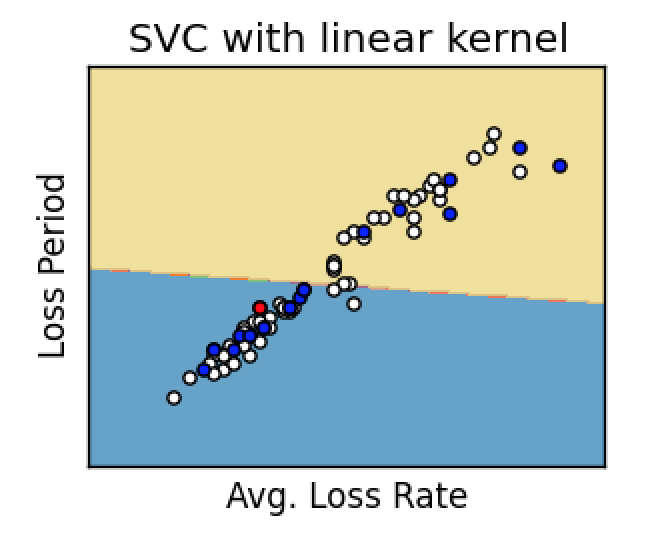
I am thinking to plot like this
If I use a classifier e.g SVM, I can plot the results before cross validation step and can show train and test data and misclassifications as in shown in figure.
K-fold Cross validation will do this step (Train/Test split K times with different random split)
In figure, white data points are training data, blue data points are testing data and read data point is misclassification.
I was thinking I can show this plot and show the mean of k-fold cross validation score. But please suggest me any ideas How to visualise data after cross validation step or How to better visualise it.
Purpose of Visualisation: I have intentions to use two classifiers (eg. SVM and logistic regression) and check which classifier performs well and then choose the best performing model for further classification of out of sample data.
