13
$\begingroup$

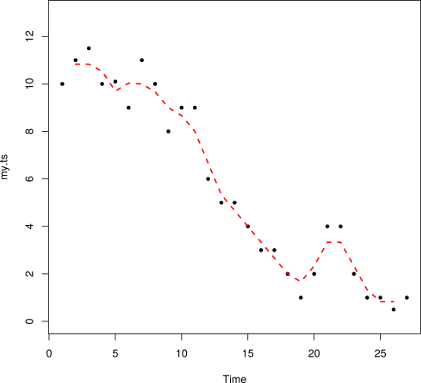
Suppose I have following non-periodic time series. Obviously the trend is decreasing and I would like to prove it by some test (with p-value). I am unable to use classic linear regression due to strong temporal (serial) auto-correlation among values.

library(forecast)
my.ts <- ts(c(10,11,11.5,10,10.1,9,11,10,8,9,9,
               6,5,5,4,3,3,2,1,2,4,4,2,1,1,0.5,1),
            start = 1, end = 27,frequency = 1)
plot(my.ts, col = "black", type = "p",
     pch = 20, cex = 1.2, ylim = c(0,13))
# line of moving averages 
lines(ma(my.ts,3),col="red", lty = 2, lwd = 2)

enter image description here

What are my options?

$\endgroup$
9
  • 4
    $\begingroup$ I think the fact that the series is non-periodic (frequency=1) is little relevant here. A more relevant issue could be whether you are willing to specify a functional form for your model. $\endgroup$ Commented Feb 10, 2016 at 12:17
  • 1
    $\begingroup$ Some more information about what the data is would probably be useful for modeling. $\endgroup$
    – bdeonovic
    Commented Feb 10, 2016 at 12:23
  • $\begingroup$ Data are counts of individuals (in thousands) of certain species counted every year in water reservoir. $\endgroup$ Commented Feb 10, 2016 at 12:47
  • 1
    $\begingroup$ @LadislavNado is your series that short as in the example provided? I ask because if so, it reduces the number of methods that can be employed due to sample size. $\endgroup$
    – Tim
    Commented Feb 12, 2016 at 13:03
  • 1
    $\begingroup$ The obviousness of the decreasing aspect is quite scale dependent, which, to me, should be taken into account $\endgroup$ Commented Feb 16, 2016 at 22:48

5 Answers 5

9
+50
$\begingroup$

As you said, the trend in your example data is obvious. If you want just to justify this fact by hypothesis test, than besides using linear regression (the obvious parametric choice), you can use non-parametric Mann-Kendall test for monotonic trend. The test is used to

assess if there is a monotonic upward or downward trend of the variable of interest over time. A monotonic upward (downward) trend means that the variable consistently increases (decreases) through time, but the trend may or may not be linear. (http://vsp.pnnl.gov/help/Vsample/Design_Trend_Mann_Kendall.htm)

moreover, as noted by Gilbert (1987), the test

is particularly useful since missing values are allowed and the data need not conform to any particular distribution

The test statistic is the difference between negative and positive $x_j-x_i$ differences among all the $n(n-1)/2$ possible pairs, i.e.

$$ S = \displaystyle\sum_{i=1}^{n-1}\displaystyle\sum_{j=i+1}^{n}\mathrm{sgn}(x_j-x_i) $$

where $\mathrm{sgn}(\cdot)$ is a sign function. $S$ can be used to calculate $\tau$ statistics that is similar to correlation as it ranges from $-1$ to $+1$, where the sign suggests negative, or positive trend and value of $\tau$ is proportional to slope of the trend.

$$ \tau = \frac{S}{n(n-1)/2} $$

Finally, you can compute $p$-values. For samples of size $n \le 10$ you can use tables of precomputed $p$-values for different values of $S$ and different sample sizes (see Gilbert, 1987). With larger samples, first you need to compute variance of $S$

$$ \mathrm{var}(S) = \frac{1}{18}\Big[n(n-1)(2n+5) - \displaystyle\sum_{p=1}^{g}t_p(t_p-1)(2t_p+5)\Big] $$

and then compute $Z_{MK}$ test statistic

$$ Z_{MK} = \begin{cases} \frac{S-1}{\mathrm{var}(S)} & \text{if} ~ S > 0 \\ 0 & \text{if} ~ S = 0 \\ \frac{S+1}{\mathrm{var}(S)} & \text{if} ~ S < 0 \end{cases} $$

the value of $Z_{MK}$ is compared to standard normal values

  • $Z_{MK} \ge Z_{1-\alpha}$ for upward trend,
  • $Z_{MK} \le -Z_{1-\alpha}$ for downward trend,
  • $|Z_{MK}| \ge Z_{1-\alpha/2}$ for upward or downward trend.

In this thread you can find R code implementing this test.

Since the $S$ statistic is compared to all possible pairs of observations then, instead of using normal approximation for $p$-value you can use permutation test that is obvious for this case. First, you compute $S$ statistic from your data and then you randomly shuffle your data multiple times and compute it for each of the samples. $p$ is simply the proportion of cases when $S_\text{data} \ge S_\text{permutation}$ for upward trend or $S_\text{data} \le S_\text{permutation}$ for downward trend.


Gilbert, R.O. (1987). Statistical Methods for Environmental Pollution Monitoring. Wiley, NY.

Önöz, B., & Bayazit, M. (2003). The power of statistical tests for trend detection. Turkish Journal of Engineering and Environmental Sciences, 27(4), 247-251.

$\endgroup$
0
1
$\begingroup$

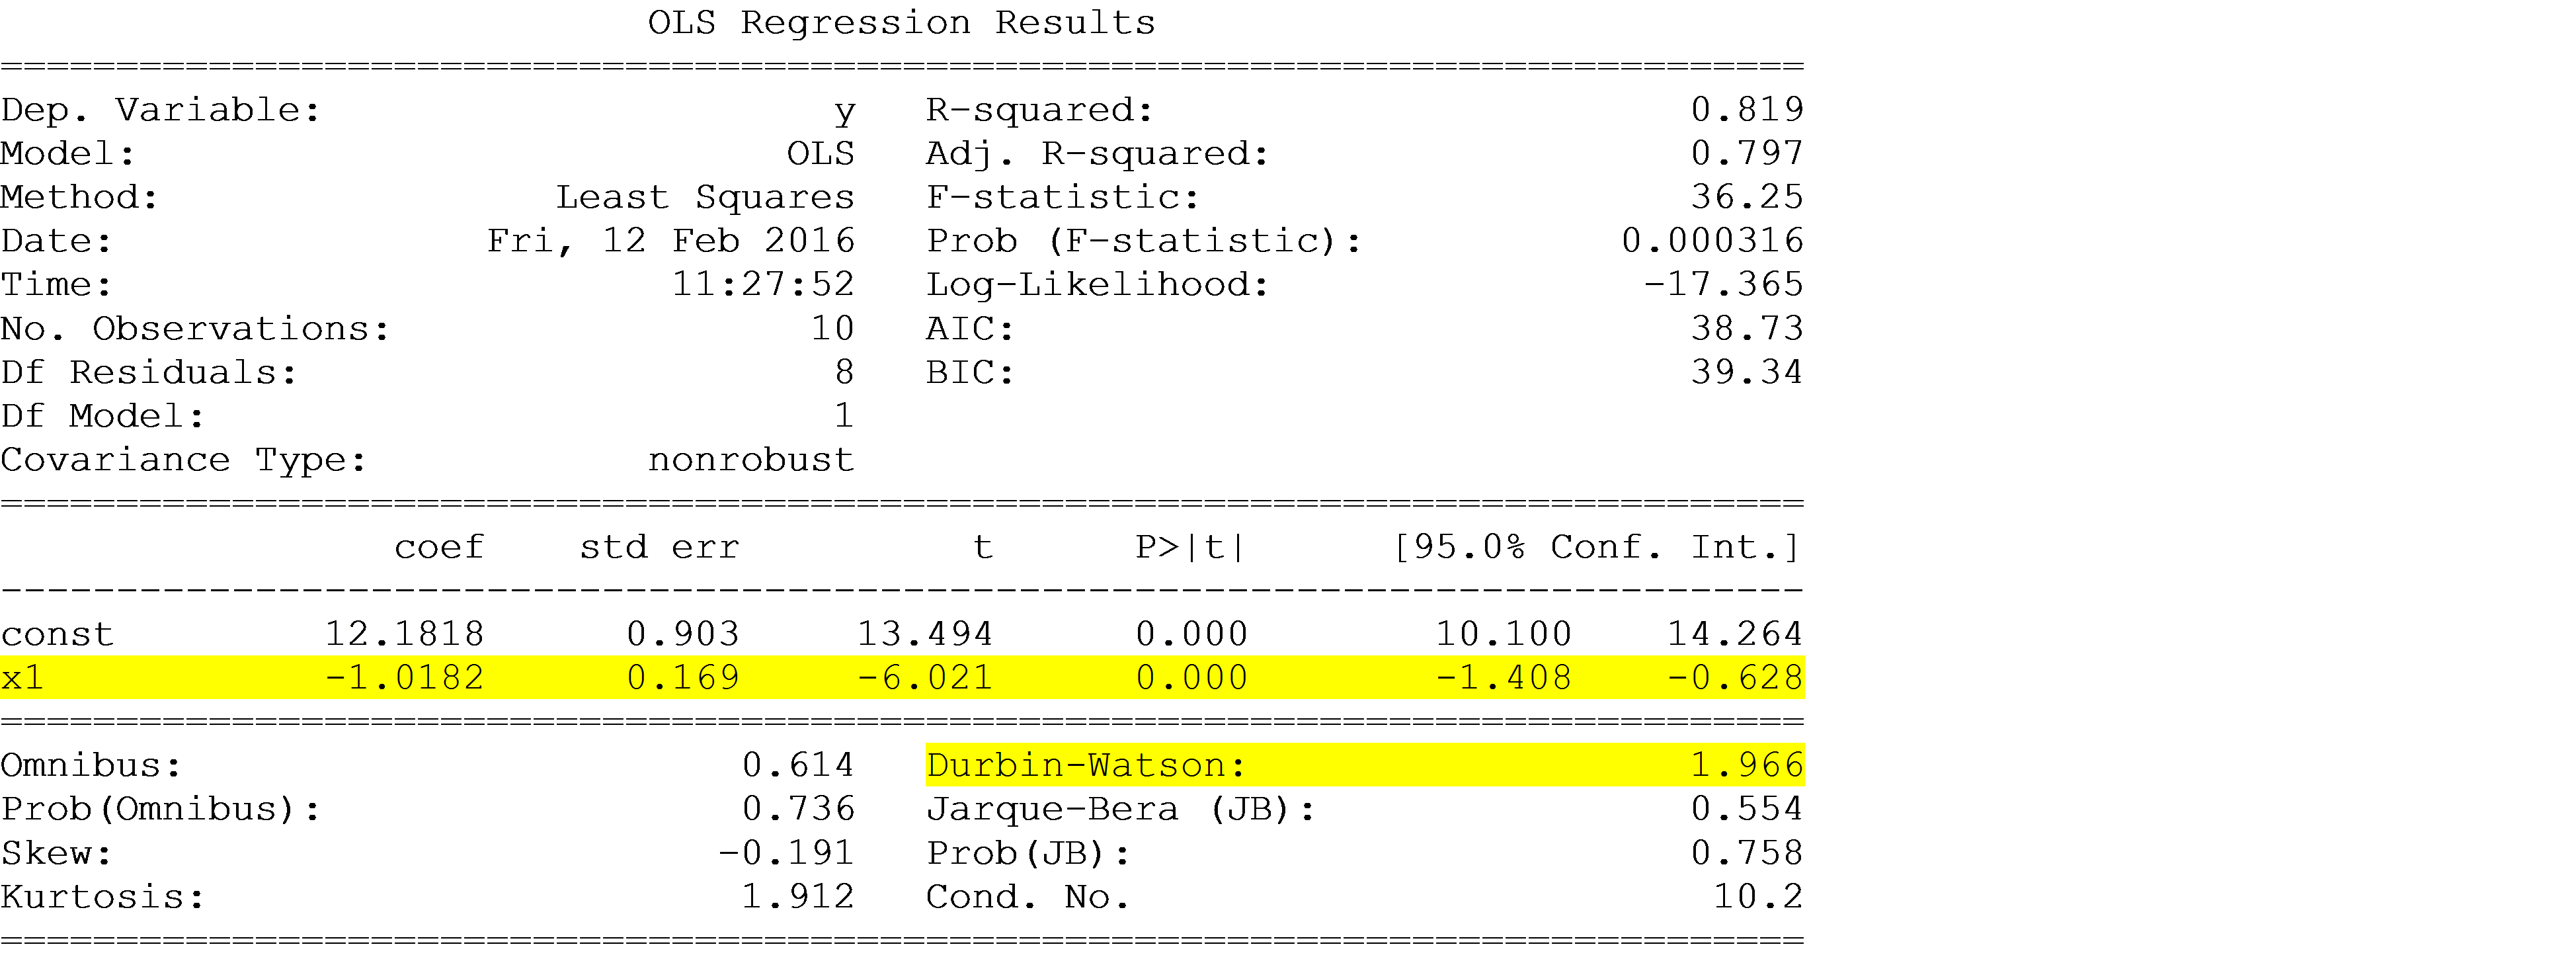
You can use OLS because there is no serial autocorrelation (at least in the sample you supplied); note the Durbin-Watson test statistic of 1.966 (≈2).

So, the significantly negative coefficient estimate for x1 is all you need to say something like

The observed count of [certain species] is decreasing by about 1,000 per year.

or

The observed count of [certain species] is decreasing by between 628 and 1,408 per year (at 95% confidence).

This assumes that the methodology for counting the species has good coverage and is consistent over the years in your sample.

enter image description here

This was produced with this Python code (sorry; don't have R handy):

import numpy as np
import statsmodels.api as sm

y = [10,12,10,11,8,9,6,4,2,4]
x = np.arange(len(y))
x = sm.add_constant(x)

mod = sm.OLS(y, x)
result = mod.fit()
print(result.summary())
$\endgroup$
1
$\begingroup$

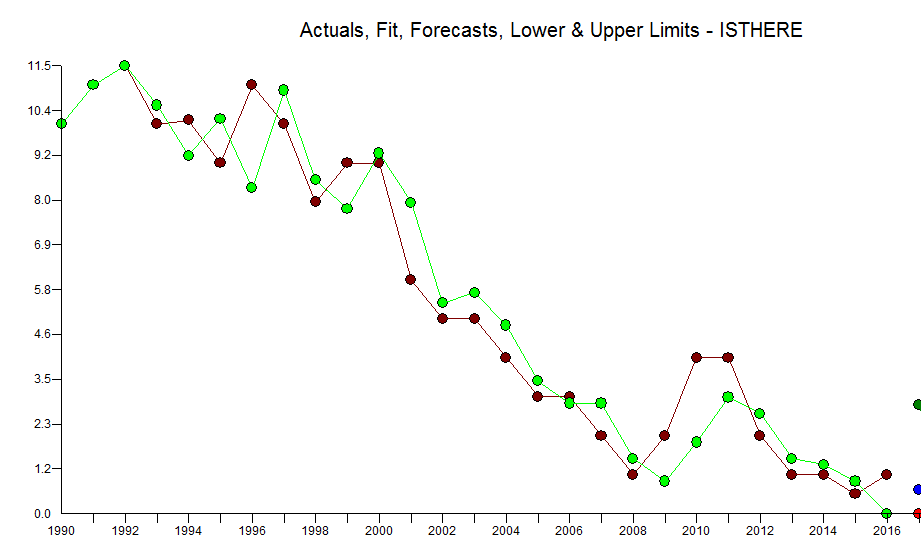
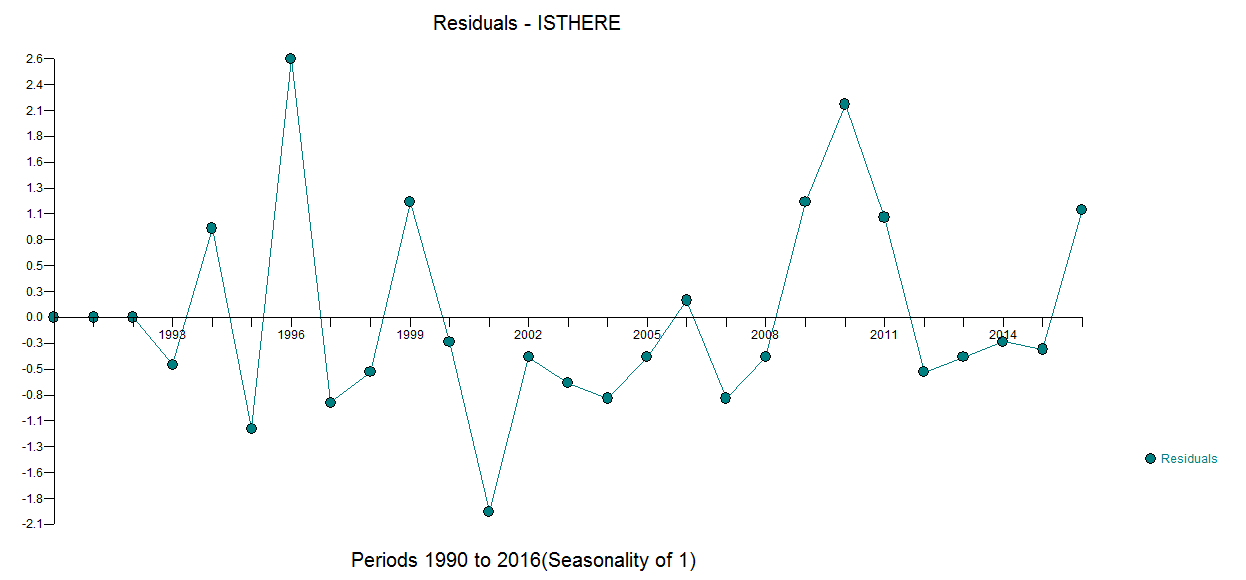
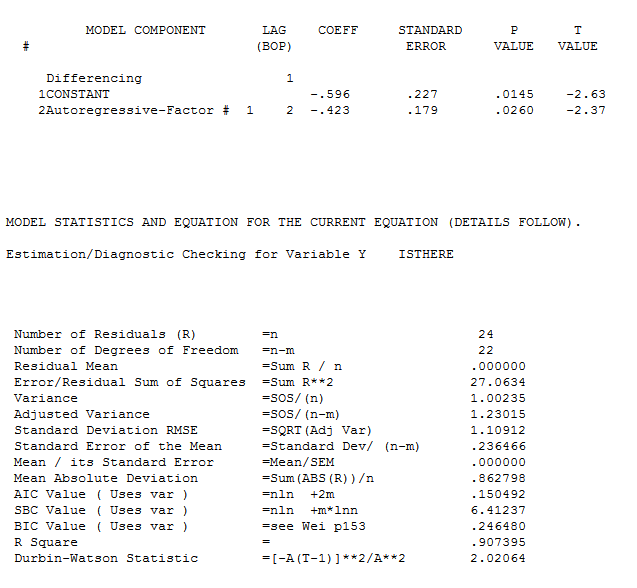
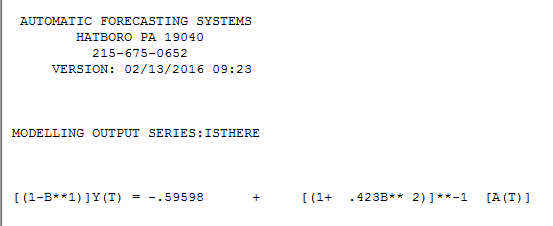
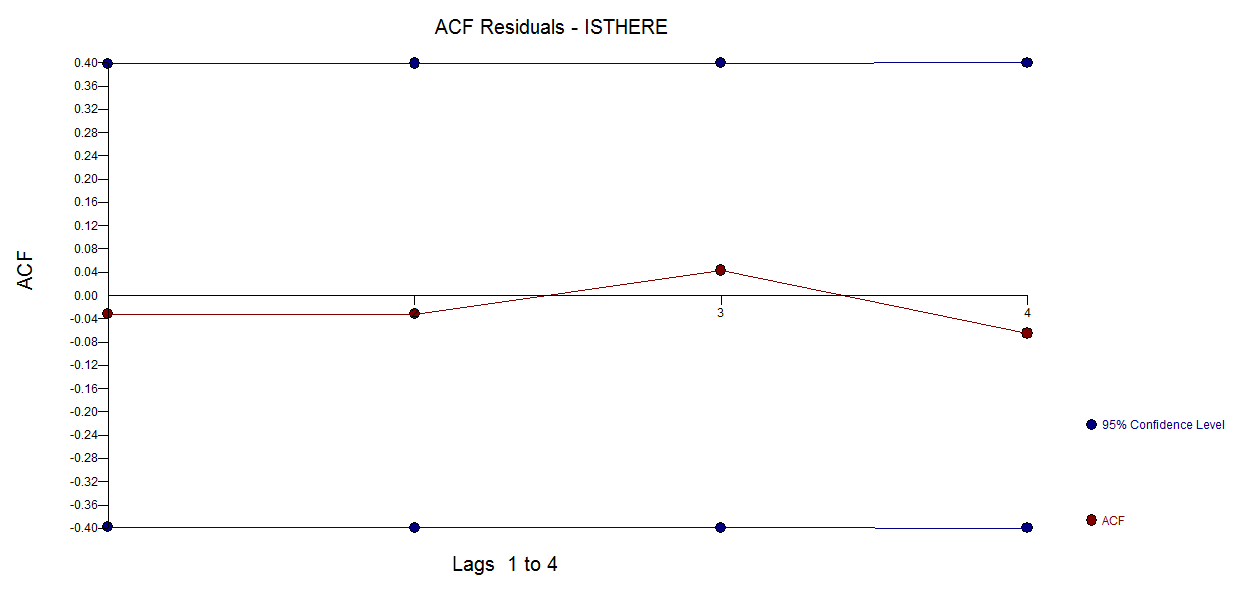
The problem that you have "I am unable to use classic linear regression due to strong temporal (serial) auto-correlation among values." is in reality an opportunity. I took your 27 values and used AUTOBOX a piece of software (which I have helped develop) that can (optionally) automatically determine a possible model. Here is the actual/fit and forecast graph enter image description here . The ACF of the residuals is here with residual plot here enter image description here . The model is here enter image description here and here enter image description here and here enter image description here . Two coefficients aptly describe the data with estimated "trend" aka "drift" i.e. period to period differential of -.596. Note that this is one kind of trend where your model used the counting numbers 1,2,...27 as a predictor variable. If your data suggested that kind of trend then the software would have found it to be more applicable. I will try and find an earlier post of mine which fully detailed/contrasted these two kinds of trends. Here Identifying a stochastic trend model and Detecting initial trend or outliers

enter image description here

$\endgroup$
4
  • 2
    $\begingroup$ Autobox forecast misses every interesting point 1996, 1999, 2000, 2009 where the recent trend is broken. It's almost like phase shift by one year. In that regard it doesn't explain anything. $\endgroup$
    – Aksakal
    Commented Feb 16, 2016 at 20:17
  • $\begingroup$ Your previous recommendation (tongue in cheek) of fitting a high degree polynomial to data would do what just what you asked for . But we are not about fitting we are about modelling. The residual plot seems to adequately describe an error process due to some external/unknown factor. All models are wrong but some are useful. This I believe is a useful model but if you think you can do better please post your results so we can all learn. There is no explanation from an ARIMA model as the past is just a proxy for omitted variables. $\endgroup$
    – IrishStat
    Commented Feb 17, 2016 at 1:45
  • 2
    $\begingroup$ In this case it seems that there's not much to do with statistics. It's not en interesting stats question at all. There's an obvious trend, and OP must study the physics of the phenomenon. I think these model fits like from Autobox are simply leading OP in the wrong direction. They're not revealing anything of value beyond what's evident already. $\endgroup$
    – Aksakal
    Commented Feb 17, 2016 at 1:56
  • $\begingroup$ The question is whether or not analytic can replace the human eye ...The analysis reveals what the eye supports, This is why we practice statistics in order to do possibly do more than may be immediately visable. The AUTOBOX solution leads the OP in the right direction i.e. down . Your comments are not at all productive in my opinion BUT as I previously asked (politely) please provide a statistics based viable alternative . In my opinion this is a very interesting statistical question and requires an answer. Please provide one if you can. $\endgroup$
    – IrishStat
    Commented Feb 17, 2016 at 2:45
1
$\begingroup$

You can use Spearman's rank correlation coefficient to determine the degree to which you data is monotonic. It returns positive values for monotonic increasing data and negative values for monotonic decreasing data (between -1 and +1). Following the link above, there is also a section dealing significance testing, although I am sure most software packages will have a p-value done for you when computing correlation coefficients (e.g. in Matlab: [RHO,PVAL] = corr(...); in R: cor.test(x,...))

$\endgroup$
0
$\begingroup$

Knowing the source of data would be very helpful, and also the information if the values of my.ts could get negative or not.

However, taking a quick look on the plot, rather than seeing a constant linear trend, I rather suggest that the time series is not stationary, hence integrated. As an example, stock prices are also integrated, but stock returns not anymore (they fluctuate near 0).

This hypothesis can also be tested using the Augmented Dickey Fuller Test:

require(tseries)
adf.test(my.ts)

Augmented Dickey-Fuller Test
Dickey-Fuller = -2.9557, Lag order = 2, p-value = 0.7727
alternative hypothesis: stationary

Given the p-value is not lower 0.05, there is no evidence that the process is stationary.

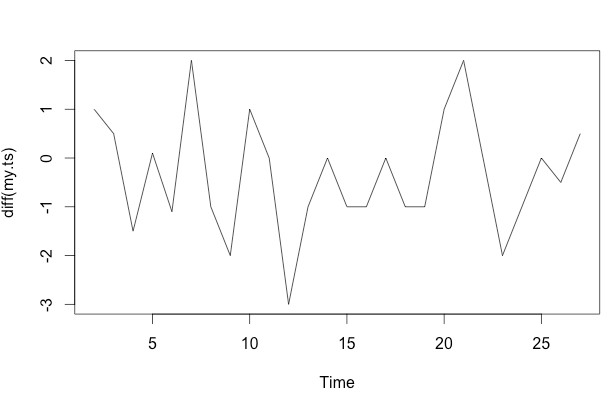
To get the data stationary, you have to difference it:

diff.ts <- diff(my.ts)
plot(diff.ts)

enter image description here

Now the data shows no trend anymore, and the only thing you will find is an autoregressive term of order 2 (using acf(diff.ts)).

$\endgroup$

Your Answer

By clicking “Post Your Answer”, you agree to our terms of service and acknowledge you have read our privacy policy.

Not the answer you're looking for? Browse other questions tagged or ask your own question.