2
$\begingroup$

I am attempting to calculate the RMSE in-sample value from a GARCH model.

fit.spec1a[[1]]=ugarchspec(variance.model = list(model = "sGARCH",
                                               garchOrder = c(2,0)),
                         mean.model= list(armaOrder = c(1,0),
                                          include.mean = T), 
                         distribution.model = "sstd")

garch[[i]]<- ugarchfit(data=train.set[[2]][,c(1)],spec = fit.spec1a[[1]],solver="hybrid")

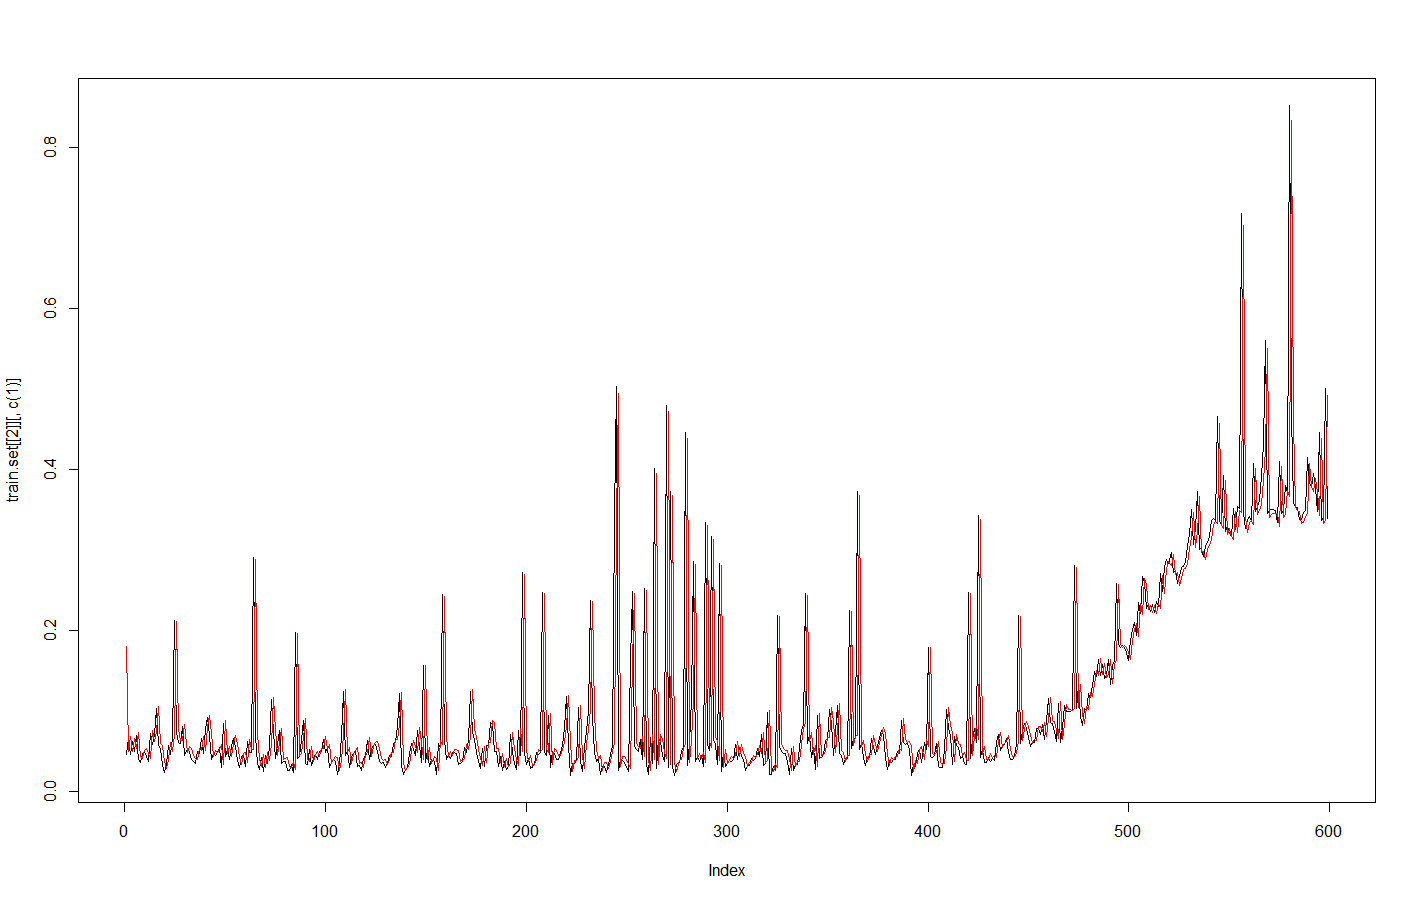
The fitted values appear to fit very well, but are off by exactly one. I am not sure why this is since the length of the test and training data are equal, and couldn't find any documemtation in the 'rugarch' package indicating that fitted values are based on T-1 values. Any help would be greatly appreciated. Below is a plot showing the fitted values (red) and the observed data. enter image description here.
$\endgroup$
4
  • $\begingroup$ If these are fitted values from the conditional mean model, you should perhaps change the title (as GARCH mainly concerns the conditional variance rather than the conditional mean). $\endgroup$ Commented Feb 21, 2016 at 9:49
  • $\begingroup$ But these actually look more like the fitted values from the conditional variance model... Anyway, GARCH(1,1) is somewhat similar to ARMA(1,1), and often the "autoregressive" coefficient in GARCH(1,1) is close to 1 while the "moving average" coefficient is close to zero, hence producing a behaviour similar to AR(1) with a near-unit-root. $\endgroup$ Commented Feb 22, 2016 at 7:14
  • $\begingroup$ That makes sense, I really appreciate your help in this matter. Thank-you! $\endgroup$
    – Hannah
    Commented Feb 22, 2016 at 16:41
  • $\begingroup$ I am only glad I could help! $\endgroup$ Commented Feb 22, 2016 at 17:09

1 Answer 1

1
$\begingroup$

If the graph depicts the original series and the fitted values from the conditional mean model, then here is my guess.

You have specified ARMA order (1,0) which is an AR(1) model. It looks as if the fitted model is a near-unit-root AR(1); could you show us the AR(1) coefficient? A near-unit-root AR(1) model makes the fitted series look very much like the actual series lagged by one, although the fitted series has a slightly smaller amplitude (in your case, the red spikes are slightly lower than the preceding black spikes). Even though you say The fitted values appear to fit very well <...>, this is a misleading impression; the vertical differences between the original series and the fitted values are quite large, and this is what matters.

So if your graph really depicts the original series and the fitted values, there may be no technical mistake and the off by one behaviour may be expected given your model. Whether AR(1) is a suitable model for this data is another question.

$\endgroup$
2
  • $\begingroup$ My apologies, I have edited the title to better reflect the topic.I further investigated your theory. I added two external regressors in the mean model to account for the change in slope and trend, and the ar1 coefficient is now 0.624. The fitted values look less similar to the observed, but I am still seeing this very evident lag nature of the fitted values. I have seen that other GARCH packages set the time t=1 fitted value as NA, so I'm not sure if I'm using this rugarch package wrong, or that is just the nature of the ar1 model? I really appreciate your help! $\endgroup$
    – Hannah
    Commented Feb 21, 2016 at 21:49
  • $\begingroup$ This is the nature of the AR(1) model. $\endgroup$ Commented Feb 22, 2016 at 6:00

Your Answer

By clicking “Post Your Answer”, you agree to our terms of service and acknowledge you have read our privacy policy.

Not the answer you're looking for? Browse other questions tagged or ask your own question.