2
$\begingroup$

When trying to estimate the proportion of a sample (eg. proportion of patients undergoing an operation who experience a complication) one starts with the data (number of "successes", number of trials) and a prior distribution of that proportion parameter, typically beta(1,1).

What happens when one knows as sure "as God made little apples" that the proportion who will experience complications is not 50%. What happens if we are confident that the parameter possibilities do not span the spectrum from 0 to 100%. We expect the complication rate to be about 10% or there abouts. 50% would be very very very unlikely. If you want to see more details about my case you can look here but my question is a general one.

$\endgroup$
2
  • 2
    $\begingroup$ Use a prior that reflects what you know and how well you know it. $\endgroup$
    – mef
    Commented Mar 2, 2016 at 23:59
  • 2
    $\begingroup$ The $\beta(1,1)$ prior is the uniform distribution. Thus, while the mean is indeed 50%, 50% is equally likely as any other value. That's not a reason to use it if you think the rate is less than 50%, but just pointing out that a $\beta(1,1)$ prior is not the same thing as saying "we think the complication is something like 50%" $\endgroup$ Commented Mar 3, 2016 at 1:23

1 Answer 1

3
$\begingroup$

"We expect the complication rate to be about 10% or there abouts. 50% would be very very very unlikely."

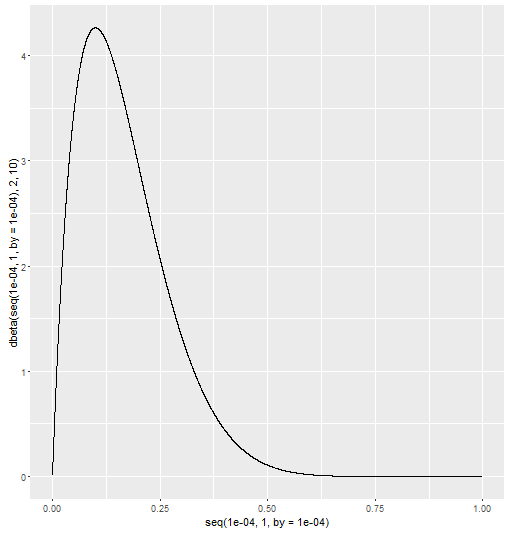
These two sentence can be translated into a prior. As you point out, the Beta distribution is the conjugate prior for the Binomial, so that's what we'll use. If the complication rate is about $10\%$, then it makes sense to use a beta distribution with a mean of around $0.1$. All we need to do is pick the $\alpha$ and $\beta$ parameters. The mode of the beta distribution is $\frac{\alpha - 1}{\alpha + \beta - 2}$, so picking an $\alpha$ and a $\beta$ that makes that fraction something like $0.1$ makes sense. How about $\alpha = 2, \beta = 10$?

That gives you a prior distribution that looks something like this: enter image description here

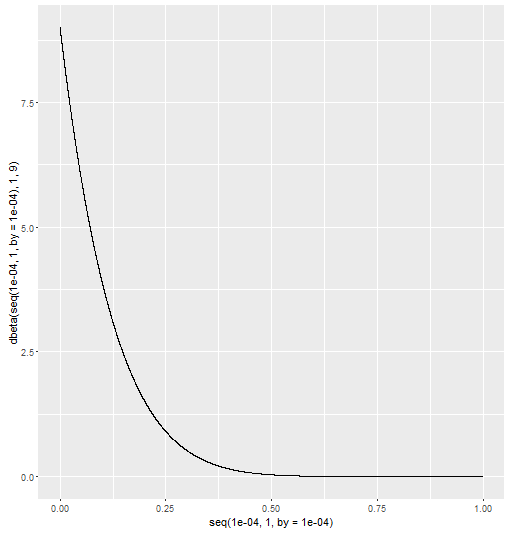
The mode is right around 10%, the mean is around 17%. There is a small, but not negligible probability of a rate of around 50%. Or you could push more of the prior weight to values at or below 10% by using something like, $\alpha = 1, \beta = 9$: enter image description here

It's easy enough to generate a beta distribution and visually inspect it. Here is some bare bones base R code:

alpha = 1
beta = 9
plot(x = seq(0.0001, 1, by = .0001), 
     y = dbeta(seq(0.0001, 1, by = .0001), alpha, beta),
     type = "l")

If you can make a plot match your prior intuition, then you have found your prior distribution.

$\endgroup$

Your Answer

By clicking “Post Your Answer”, you agree to our terms of service and acknowledge you have read our privacy policy.

Not the answer you're looking for? Browse other questions tagged or ask your own question.