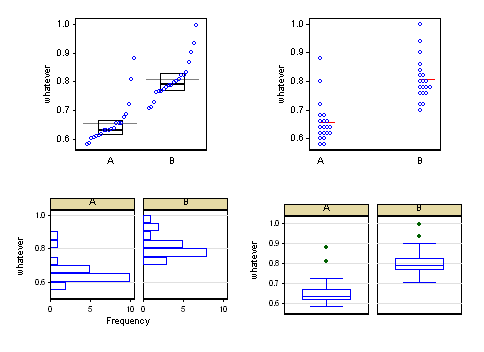
I've got two different distributions of participant reaction time means (20 data points for condition A, another 20 for condition B). I'm stuck trying to decide between using a histogram, or a box plot to display the differences in the distribution. I'd appreciate any opinions on the matter.
EDIT
Here's the data, in case you want to play around with it / offer suggestions:
A = [0.87923964999999993, 0.58451829999999994, 0.80928291666666674, 0.68699328333333343, 0.72234159999999992, 0.65511489999999983, 0.65493080000000015, 0.65603638333333325, 0.60245800000000005, 0.6110293166666666, 0.63731213333333325, 0.62952980000000003, 0.61440959999999989, 0.67764006666666687, 0.61654928333333325, 0.60551748333333311, 0.63183041666666673, 0.63157981666666674, 0.63295355000000009, 0.58176853333333312]
B = [0.99643063333333315, 0.72695231666666671, 0.93434573333333326, 0.90142753333333336, 0.78560038333333337, 0.82246491666666666, 0.86708678333333333, 0.77973181666666647, 0.82362093333333319, 0.83155454999999989, 0.77494198333333331, 0.80204511666666667, 0.76222439999999991, 0.80875108333333323, 0.79778146666666672, 0.76476253333333311, 0.76522888333333339, 0.70649123333333341, 0.71163546666666666, 0.78614491666666664]

