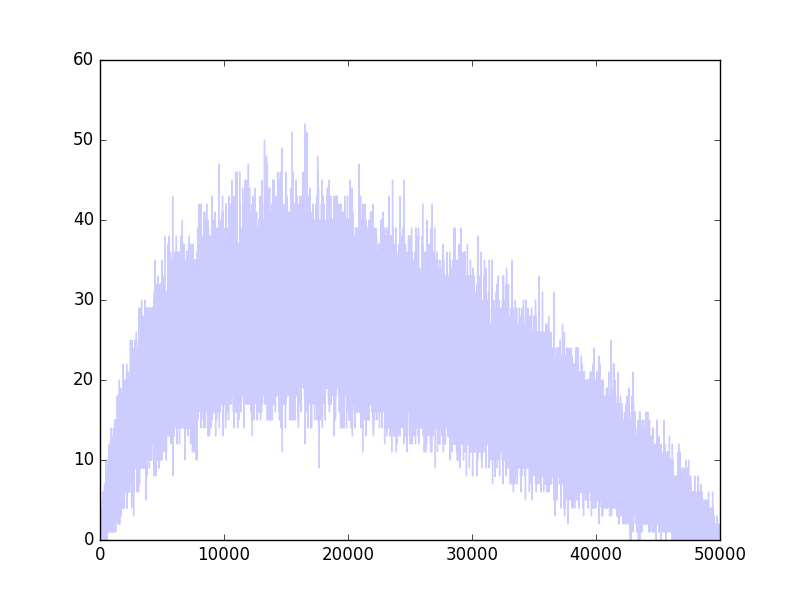
I have binominal data: For each of $x_i = 1,\ldots,49999$, I have the number of successes $s_i$, out of $n_i$ experiments. It so happens that $n_i = 50000-i$. Here is a plot of $s_i$:
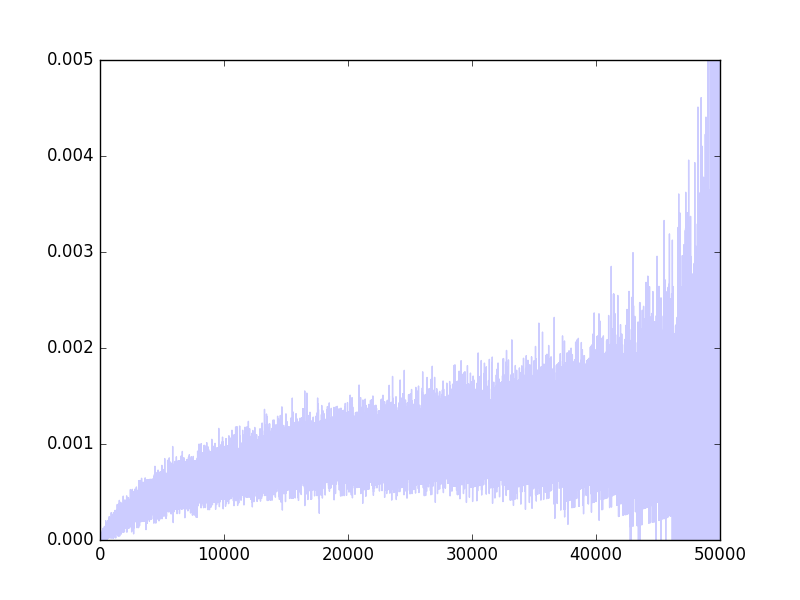
And here is a plot of $s_i/n_i$, which is an unbiased estimate of $p_i$, the probability of success as a function of $i$:
In particular, $p_i$ is known to be a monotone increasing function of $i$.
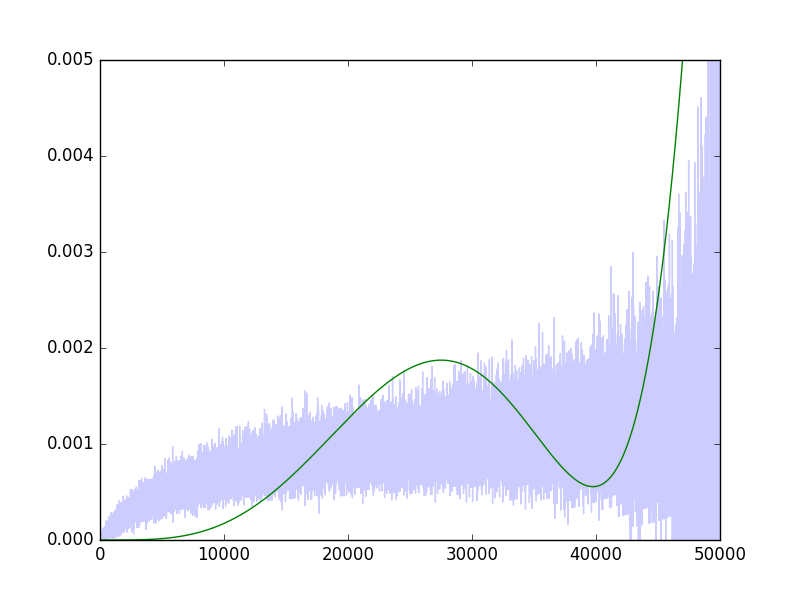
I am fitting a GLM (using Python's statsmodels), with a Binomial family, when the input is a polynomial of $x_i$, of a given degree, say 6. I am trying various link functions, in particular the identity function and the logit function, but I am getting weird results. For example, here are the predicted probabilities with the identity link function:
endog = array([successes, trials-successes]).T
exog = power.outer(xs, arange(deg+1))
LR = sm.GLM(endog, exog, family=sm.families.Binomial(link=statsmodels.genmod.families.links.logit)).fit()

print LR.summary()
                 Generalized Linear Model Regression Results
==============================================================================
Dep. Variable:           ['y1', 'y2']   No. Observations:                49999
Model:                            GLM   Df Residuals:                    49997
Model Family:                Binomial   Df Model:                            1
Link Function:               identity   Scale:                             1.0
Method:                          IRLS   Log-Likelihood:            -7.0518e+05
Date:                Wed, 20 Apr 2016   Deviance:                   1.1850e+06
Time:                        11:43:23   Pearson chi2:                 1.01e+11
No. Iterations:                    38
==============================================================================
                 coef    std err          z      P>|z|      [95.0% Conf. Int.]
------------------------------------------------------------------------------
const       1.465e-36   1.96e-39    747.996      0.000      1.46e-36  1.47e-36
x1          -1.57e-26    2.1e-29   -747.996      0.000     -1.57e-26 -1.57e-26
x2          2.171e-28    2.9e-31    747.996      0.000      2.17e-28  2.18e-28
x3          2.994e-24      4e-27    747.996      0.000      2.99e-24     3e-24
x4          3.036e-20   4.06e-23    747.996      0.000      3.03e-20  3.04e-20
x5         -1.494e-24   2.17e-27   -687.236      0.000      -1.5e-24 -1.49e-24
x6           1.85e-29   2.91e-32    636.344      0.000      1.84e-29  1.86e-29
==============================================================================

plot(LR.mu)
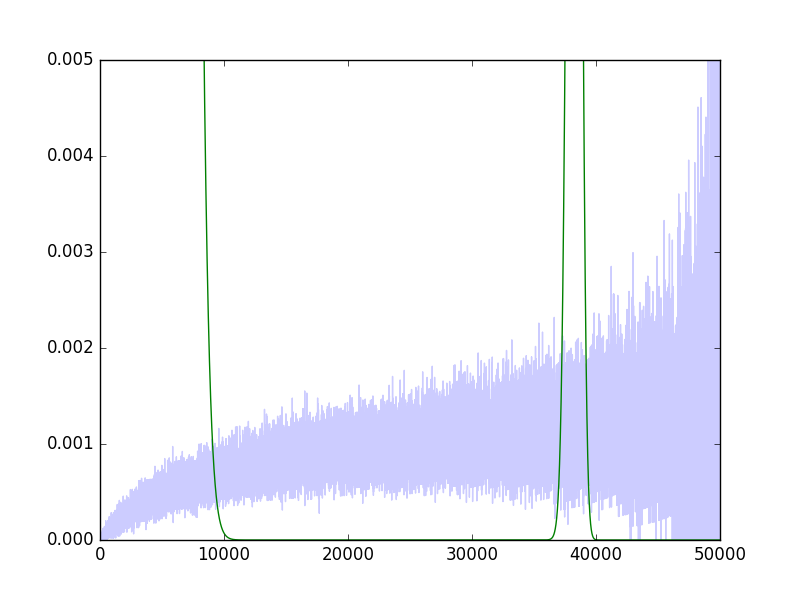
I find this result very strange, since it is very clear that a pretty smooth, close to linear line, would fit quite well (indeed this can be seen with e.g., a moving average). The logit link function is even weirder:
Generalized Linear Model Regression Results
==============================================================================
Dep. Variable:           ['y1', 'y2']   No. Observations:                49999
Model:                            GLM   Df Residuals:                    49997
Model Family:                Binomial   Df Model:                            1
Link Function:                  logit   Scale:                             1.0
Method:                          IRLS   Log-Likelihood:                    nan
Date:                Wed, 20 Apr 2016   Deviance:                          nan
Time:                        11:46:06   Pearson chi2:                 2.29e+18
No. Iterations:                    10
==============================================================================
                 coef    std err          z      P>|z|      [95.0% Conf. Int.]
------------------------------------------------------------------------------
const      -1.752e-30   2.29e-34  -7656.200      0.000     -1.75e-30 -1.75e-30
x1         -2.032e-20   2.65e-24  -7656.200      0.000     -2.03e-20 -2.03e-20
x2         -6.034e-23   7.88e-27  -7656.200      0.000     -6.04e-23 -6.03e-23
x3         -3.587e-19   4.69e-23  -7656.200      0.000     -3.59e-19 -3.59e-19
x4         -1.744e-15   2.28e-19  -7656.200      0.000     -1.74e-15 -1.74e-15
x5          9.083e-20   1.21e-23   7482.961      0.000      9.08e-20  9.09e-20
x6         -1.184e-24   1.65e-28  -7171.010      0.000     -1.18e-24 -1.18e-24
==============================================================================
I can't seem to make sense of these results. Any help?


