I am using r and have ~400 observations divided into 3 groups.
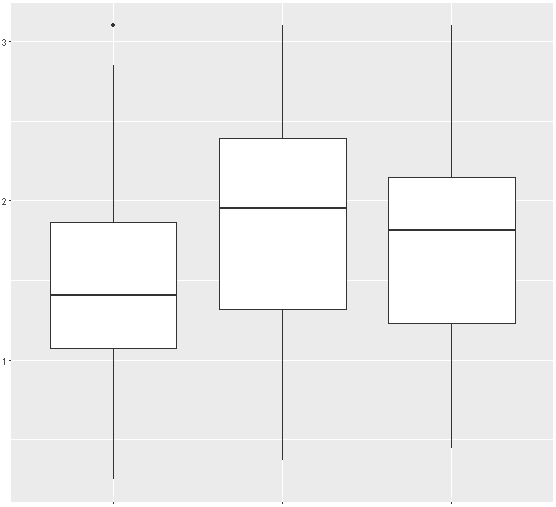
Group A contains 199 observations, while B contains 173 and C contains 24. I have generated a boxplot of their corresponding measures and would like to compare the 3rd quartile between them to see if they are significantly different. I've included the boxplot here.
I'm not sure what test I should use to compare the 3rd quartile. Does anyone know?
