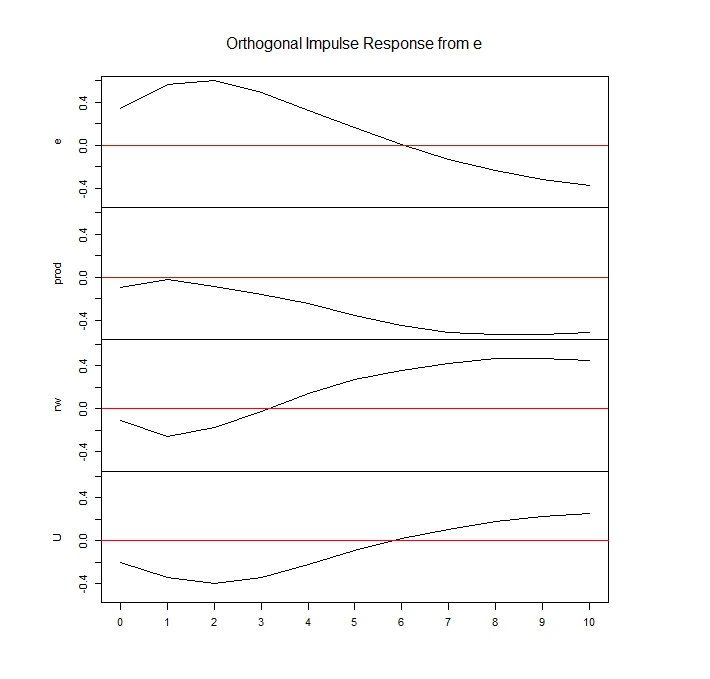
Interpretability is another issue. While you are of course right that structural responses are generally of more interest, even an orthogonal impulse response generally is more useful than the estimated VAR coefficients simply because it is easier to see the dynamic response of the variables to a shock in one variable.
Here is an example from the vars package:
library(vars)
data(Canada)
var.3c <- VAR(Canada, p = 3, type = "const")
var.3c
plot(irf(var.3c, boot = FALSE))
The estimated coeffcients are
VAR Estimation Results:
=======================

Estimated coefficients for equation e:
======================================
Call:
e = e.l1 + prod.l1 + rw.l1 + U.l1 + e.l2 + prod.l2 + rw.l2 + U.l2 + e.l3 + prod.l3 + rw.l3 + U.l3 + const

         e.l1       prod.l1         rw.l1          U.l1          e.l2       prod.l2         rw.l2          U.l2          e.l3       prod.l3
   1.75274409    0.16961948   -0.08260010    0.09951924   -1.18385358   -0.10574096   -0.02438546   -0.05077361    0.58725218    0.01053871
        rw.l3          U.l3         const
   0.03823877    0.34138928 -150.68737459


Estimated coefficients for equation prod:
=========================================
Call:
prod = e.l1 + prod.l1 + rw.l1 + U.l1 + e.l2 + prod.l2 + rw.l2 + U.l2 + e.l3 + prod.l3 + rw.l3 + U.l3 + const

         e.l1       prod.l1         rw.l1          U.l1          e.l2       prod.l2         rw.l2          U.l2          e.l3       prod.l3
  -0.14879583    1.14798569    0.02359443   -0.65814244   -0.18164920   -0.19627478   -0.20337023    0.82236693    0.57494977    0.04414683
        rw.l3          U.l3         const
   0.09336521    0.40078042 -195.86984902


Estimated coefficients for equation rw:
=======================================
Call:
rw = e.l1 + prod.l1 + rw.l1 + U.l1 + e.l2 + prod.l2 + rw.l2 + U.l2 + e.l3 + prod.l3 + rw.l3 + U.l3 + const

         e.l1       prod.l1         rw.l1          U.l1          e.l2       prod.l2         rw.l2          U.l2          e.l3       prod.l3
-4.715930e-01 -6.499785e-02  9.090532e-01 -7.940803e-04  6.667031e-01 -2.164497e-01 -1.456573e-01 -3.013740e-01 -1.288947e-01  2.139588e-01
        rw.l3          U.l3         const
 1.901601e-01  1.506129e-01 -1.166855e+01


Estimated coefficients for equation U:
======================================
Call:
U = e.l1 + prod.l1 + rw.l1 + U.l1 + e.l2 + prod.l2 + rw.l2 + U.l2 + e.l3 + prod.l3 + rw.l3 + U.l3 + const

        e.l1      prod.l1        rw.l1         U.l1         e.l2      prod.l2        rw.l2         U.l2         e.l3      prod.l3
 -0.61773366  -0.09778145   0.01454884   0.65976287   0.51811384   0.08798974   0.06993062  -0.08098673  -0.03005992  -0.01092231
       rw.l3         U.l3        const
 -0.03909215   0.06684284 114.36732138
I dare say you won't find it easy to see "what's going on".
In contrast, the plot of an impulse response function is more amenable to interpretation:


