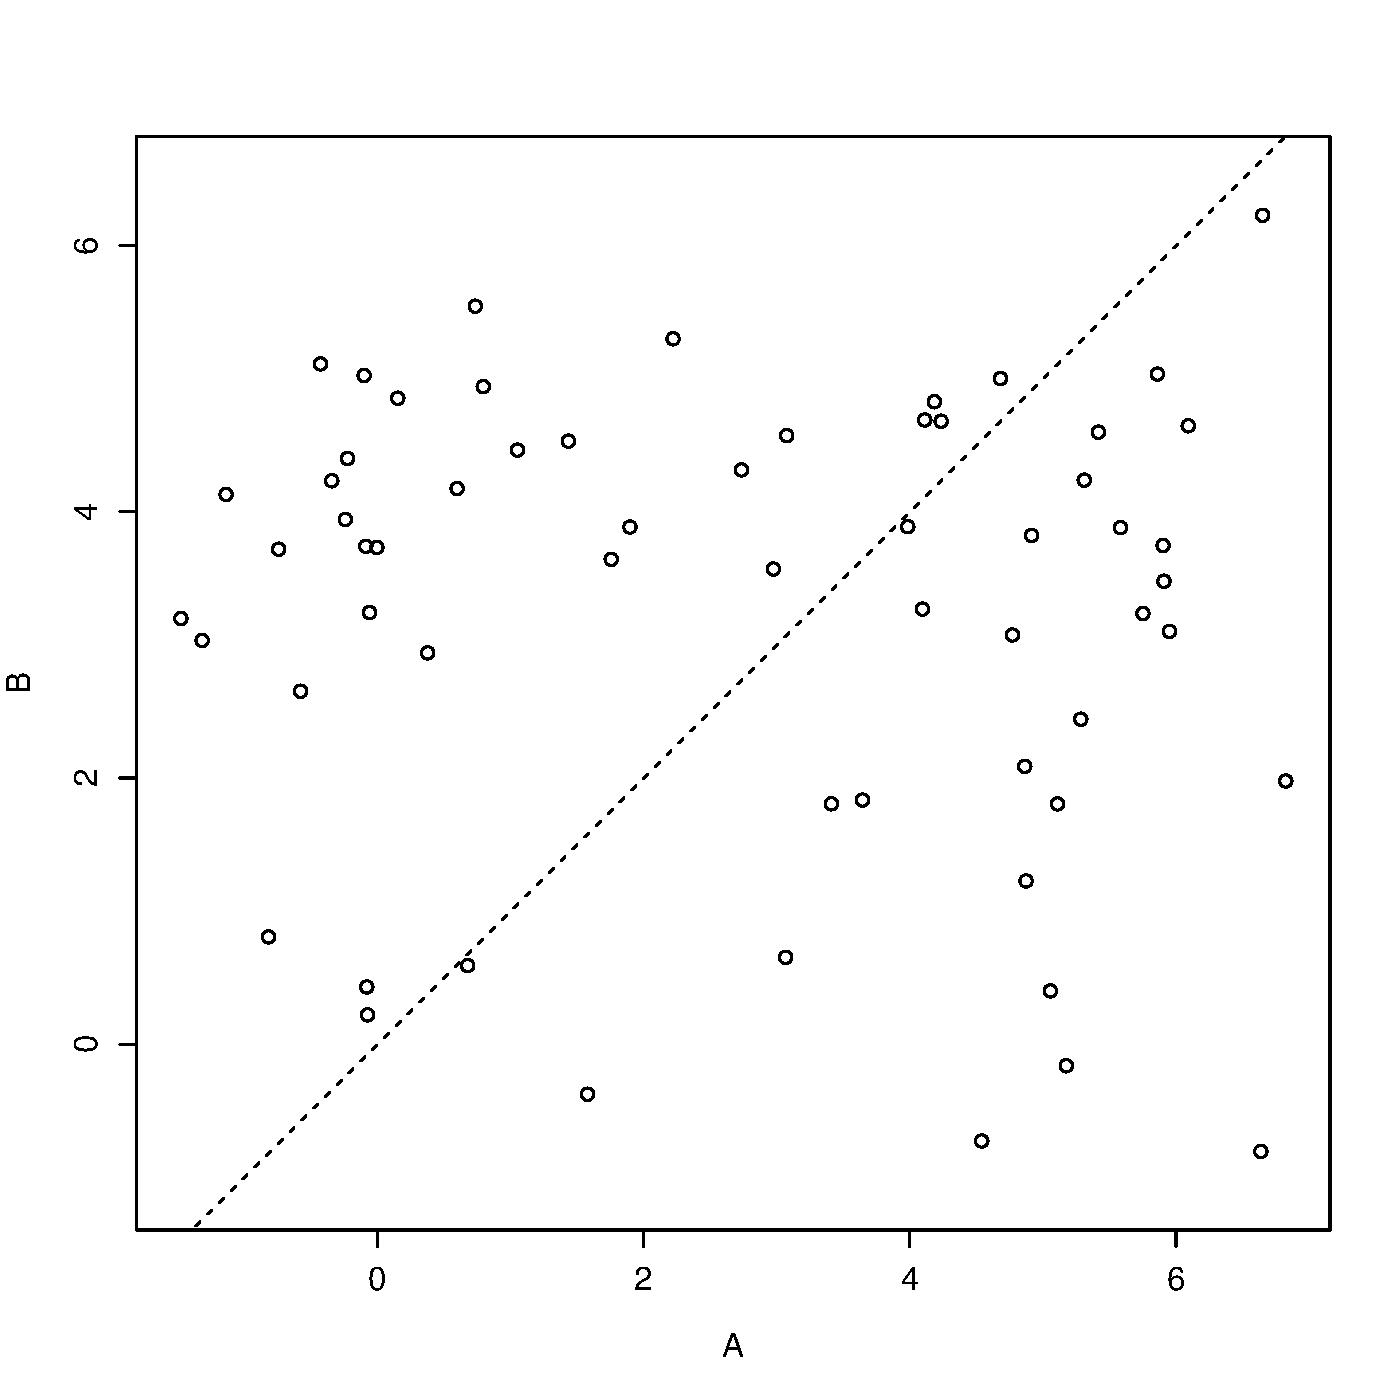
I have data that looks like this for repeated measures for the same subjects. Note, the flag column is something I just added to indicate whether there is an increase or decrease in pre vs. post for a given subject.
dput(df)
structure(list(id = c(1L, 1L, 2L, 2L, 3L, 3L, 4L, 4L, 5L, 5L,
6L, 6L, 7L, 7L, 8L, 8L, 9L, 9L, 10L, 10L, 11L, 11L, 12L, 12L,
13L, 13L, 14L, 14L, 15L, 15L, 16L, 16L, 17L, 17L, 18L, 18L, 19L,
19L, 20L, 20L, 21L, 21L, 22L, 22L, 23L, 23L, 24L, 24L, 25L, 25L,
26L, 26L, 27L, 27L, 28L, 28L, 29L, 29L, 30L, 30L, 31L, 31L, 32L,
32L, 33L, 33L, 34L, 34L, 35L, 35L, 36L, 36L, 37L, 37L, 38L, 38L,
39L, 39L, 40L, 40L, 41L, 41L, 42L, 42L, 43L, 43L, 44L, 44L, 45L,
45L, 46L, 46L, 47L, 47L, 48L, 48L, 49L, 49L, 50L, 50L, 51L, 51L,
52L, 52L, 53L, 53L, 54L, 54L, 55L, 55L, 56L, 56L, 57L, 57L, 58L,
58L, 59L, 59L, 60L, 60L, 61L, 61L), condition = c("post", "pre",
"post", "pre", "post", "pre", "post", "pre", "post", "pre", "post",
"pre", "post", "pre", "post", "pre", "post", "pre", "post", "pre",
"post", "pre", "post", "pre", "post", "pre", "post", "pre", "post",
"pre", "post", "pre", "post", "pre", "post", "pre", "post", "pre",
"post", "pre", "post", "pre", "post", "pre", "post", "pre", "post",
"pre", "post", "pre", "post", "pre", "post", "pre", "post", "pre",
"post", "pre", "post", "pre", "post", "pre", "post", "pre", "post",
"pre", "post", "pre", "post", "pre", "post", "pre", "post", "pre",
"post", "pre", "post", "pre", "post", "pre", "post", "pre", "post",
"pre", "post", "pre", "post", "pre", "post", "pre", "post", "pre",
"post", "pre", "post", "pre", "post", "pre", "post", "pre", "post",
"pre", "post", "pre", "post", "pre", "post", "pre", "post", "pre",
"post", "pre", "post", "pre", "post", "pre", "post", "pre", "post",
"pre", "post", "pre"), value = c(0.1525, 4.8535, 0.3775, 2.94,
4.184, 4.827, 3.6445, 1.834, 5.0555, 0.4, 4.771, 3.0745, 0.735,
5.545, -0.2245, 4.401, 2.221, 5.2995, 4.5405, -0.7275, 2.9745,
3.57, -0.742, 3.719, 5.903, 3.7465, -0.0595, 3.243, 4.915, 3.8225,
5.9095, 3.4785, 0.795, 4.9405, 2.736, 4.3145, 4.095, 3.2685,
-0.4275, 5.111, 3.075, 4.5725, -0.1, 5.024, 1.052, 4.4635, 5.951,
3.1015, 3.411, 1.806, 1.4345, 4.531, 4.8635, 2.0875, 5.4165,
4.5985, 5.8595, 5.035, 6.6375, -0.8055, -1.477, 3.1985, -0.004,
3.7325, 5.285, 2.442, -0.8175, 0.806, -0.08, 0.43, 3.067, 0.6525,
6.825, 1.9775, 1.5785, -0.376, 3.9845, 3.888, 0.5985, 4.174,
6.651, 6.228, 4.681, 5.0015, -0.241, 3.9425, 1.7565, 3.643, 0.678,
0.5905, 5.1105, 1.805, -0.0875, 3.741, 4.1125, 4.69, 5.1755,
-0.162, 1.897, 3.8855, 5.583, 3.881, -0.343, 4.233, 4.8735, 1.2265,
-1.1375, 4.131, 6.092, 4.646, -1.317, 3.0335, -0.074, 0.2205,
4.235, 4.681, 5.3105, 4.238, 5.7515, 3.236, -0.5775, 2.652),
    flag = c(FALSE, FALSE, FALSE, FALSE, FALSE, FALSE, TRUE,
    TRUE, TRUE, TRUE, TRUE, TRUE, FALSE, FALSE, FALSE, FALSE,
    FALSE, FALSE, TRUE, TRUE, FALSE, FALSE, FALSE, FALSE, TRUE,
    TRUE, FALSE, FALSE, TRUE, TRUE, TRUE, TRUE, FALSE, FALSE,
    FALSE, FALSE, TRUE, TRUE, FALSE, FALSE, FALSE, FALSE, FALSE,
    FALSE, FALSE, FALSE, TRUE, TRUE, TRUE, TRUE, FALSE, FALSE,
    TRUE, TRUE, TRUE, TRUE, TRUE, TRUE, TRUE, TRUE, FALSE, FALSE,
    FALSE, FALSE, TRUE, TRUE, FALSE, FALSE, FALSE, FALSE, TRUE,
    TRUE, TRUE, TRUE, TRUE, TRUE, TRUE, TRUE, FALSE, FALSE, TRUE,
    TRUE, FALSE, FALSE, FALSE, FALSE, FALSE, FALSE, TRUE, TRUE,
    TRUE, TRUE, FALSE, FALSE, FALSE, FALSE, TRUE, TRUE, FALSE,
    FALSE, TRUE, TRUE, FALSE, FALSE, TRUE, TRUE, FALSE, FALSE,
    TRUE, TRUE, FALSE, FALSE, FALSE, FALSE, FALSE, FALSE, TRUE,
    TRUE, TRUE, TRUE, FALSE, FALSE)), class = "data.frame", .Names = c("id",
"condition", "value", "flag"), row.names = c(NA, -122L))
When I run a paired t-test, the effect is not there. Can't reject null hypothesis that the mean of the differences in value is not different from zero.
t.test(value ~ condition, data = df, paired = TRUE)

    Paired t-test

data:  value by type
t = -1.2077, df = 60, p-value = 0.2319
alternative hypothesis: true difference in means is not equal to 0
95 percent confidence interval:
 -1.3192944  0.3259502
sample estimates:
mean of the differences
             -0.4966721
But, when I plot the data, there is a clear pattern of what appears to be 'opposite effect' in two sub groups.
ggplot(df, aes(x = condition, y = value, col = flag, group = id)) + geom_point() + geom_line() + theme_bw() + theme(legend.position = 'none')
A couple of questions:
1) What technique besides paired t-test is appropriate to use in such cases?
2) What criteria can one use to isolate true sub groups vs. just random variation in the data when the evidence is not as stark as in this case?

