8
$\begingroup$

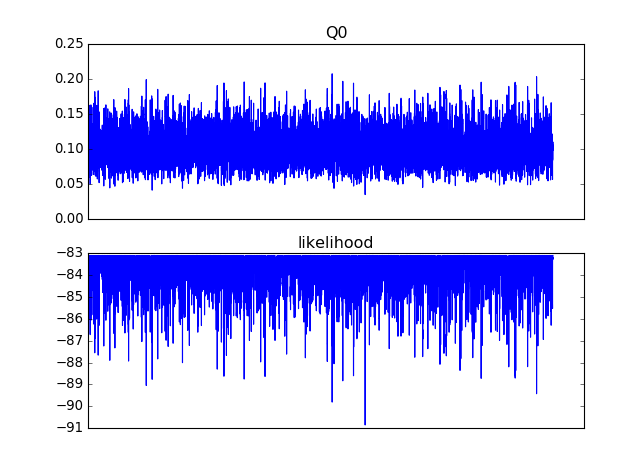
I've got a model that goes: Single parameter -> Complex likelihood function -> Log-likelihood. I executed an MCMC chain (using pymc) and plotted the trace of the parameter and the log-likelihood. The parameter estimate ended up being reasonable, but the log-likelihood plot looks strange to me.

enter image description here

The log-likelihood never goes above a certain value. I suppose this makes sense, if that value is the maximum likelihood value, but I've never seen a likelihood trace that looks like this before. my question is: is this normal?

$\endgroup$
2
  • $\begingroup$ I answered your question but I see that you started a bounty for it. Does it mean that my answer is not satisfactory and you are looking for something more? If so, why didn't it answer your question? What kind of answer you are looking for? I'd be happy to edit it if was not clear etc. $\endgroup$
    – Tim
    Commented Jun 16, 2016 at 15:04
  • $\begingroup$ Hard to answer without knowing more details about your problem. Aside Q0, what's your state space? Which MCMC method are you using? If you zoom in on the log-likelihood trace, does it oscillate below the max (with small oscillations) or do you actually get a lot of samples right on the max value? Any detail that you can spare about the likelihood? $\endgroup$
    – lacerbi
    Commented Jun 16, 2016 at 15:19

1 Answer 1

5
+50
$\begingroup$

Log-likelihood is a sum of log-densities over some datapoints, given some parameter values. Recall that densities are relative measures of "probability per foot". This means that they can be arbitrary low, or high, as in this example of uniform density. Since you sum density estimates for different points they will be always at least $N$ times the minimal value that is possible given your data and parameters. Since your MCMC algorithm wanders around some parameter space the similarity of log-likelihoods would be proportional to how "far" does it jump in subsequent steps. So given the limited information you provided, there is nothing strange in such values since there is no "typical" likelihood values.

$\endgroup$

Your Answer

By clicking “Post Your Answer”, you agree to our terms of service and acknowledge you have read our privacy policy.

Not the answer you're looking for? Browse other questions tagged or ask your own question.