1
$\begingroup$

I am new to clustering. My apology if this has been asked before.

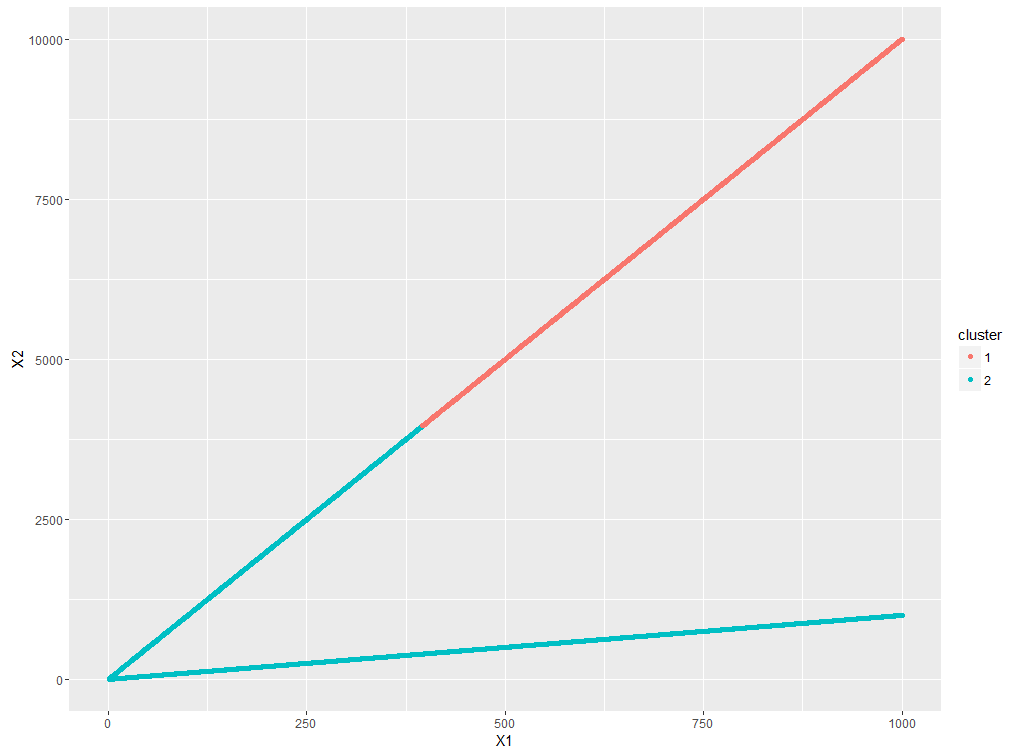
I'd like to differentiate two distinct linear populations within sample matrix, and tag them differently. Apparently k-means couldn't do a good job, which is shown in the plot below. Does anybody have any good suggestion?

Example code:

x <- c(1:1000)
y <- x
y2 <- 10 * x
sample <- matrix(c(x, x, y, y2), nrow = 2000)

enter image description here

Thanks a lot!

$\endgroup$
2
  • $\begingroup$ Thank Imo. I'll post it over there. I thought the sample size & data type are there in the sample code... $\endgroup$
    – Jin
    Commented Jun 14, 2016 at 18:45
  • $\begingroup$ If you wait a minute this question will be migrated over there. I assumed you were just presenting an example rather than the full dataset you are working with. $\endgroup$
    – lmo
    Commented Jun 14, 2016 at 18:49

1 Answer 1

0
$\begingroup$

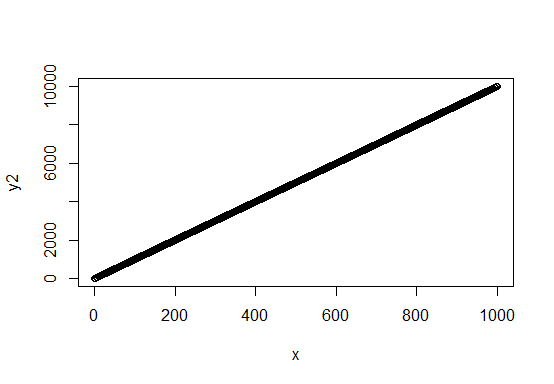
It might be because this data does not contain any actual clusters.

plot(x,y2)

enter image description here

$\endgroup$
1
  • $\begingroup$ Thanks Bryan. The sample matrix actually shows something different. $\endgroup$
    – Jin
    Commented Jun 14, 2016 at 22:33

Your Answer

By clicking “Post Your Answer”, you agree to our terms of service and acknowledge you have read our privacy policy.

Not the answer you're looking for? Browse other questions tagged or ask your own question.