6
$\begingroup$

Why does plot(ecdf(1:1000)) produce a straight line? plot(ecdf(1:1000)) in R
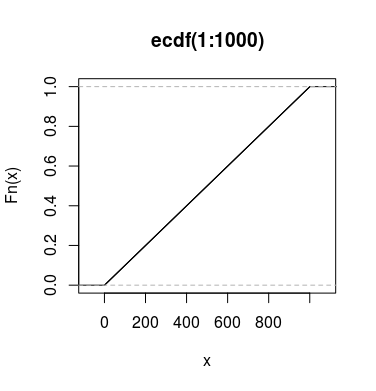
Since Fn($x_n$) = $x_1$/(total sum) +$x_2$/(total sum) +...+$x_n$/total sum = ($x_1+x_2+x_3+...+x_n$)/total sum. the fact that Fn(200) roughly being equal to 0.2 and sum(0:200) roughly being equal to 0.4 seems to indicate that sum(1:200) is roughly half of sum(1:400), which isn't true, the two expressions being 20,000 and 80,000 respectively.

What am i misunderstanding?

$\endgroup$
1
  • 3
    $\begingroup$ Give a good look. It is a step function. $\endgroup$
    – Khashaa
    Commented Jul 4, 2016 at 23:58

4 Answers 4

11
$\begingroup$

The cumulative distribution function of a random variable $X$ has nothing to do with summing the random variable. It is

the probability that $X$ will take a value less than or equal to $x$.

And of course, the probability that a value randomly sampled from your vector $(1, \dots, 1000)$ is less than or equal to 200 is exactly half the probability that it is less than or equal to 400.

$\endgroup$
8
$\begingroup$

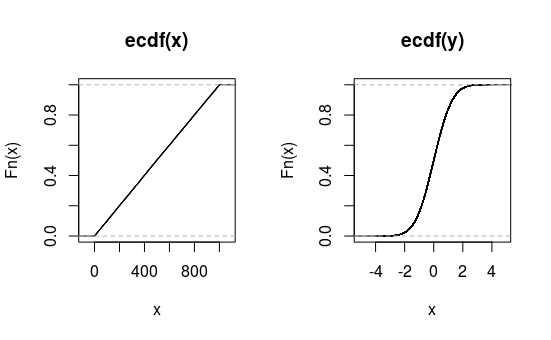
Empirical cumulative distribution function is a cumulative sum of frequencies of observed $x_i$'s divided by total sample size. Your data is a vector of values from $1$ to $1000$, where each of the values appears exactly once. This means that your "variable" follows a discrete uniform distribution, that has a flat CDF.

As you can see on the example below, it'd be different if you used other imput data.

set.seed(123)

x <- sample(0:1000, 1e5, replace = TRUE)
y <- rnorm(1e5)

def <- par(mfrow = c(1,2))
plot(ecdf(x))
plot(ecdf(y))
par(def)

enter image description here

or

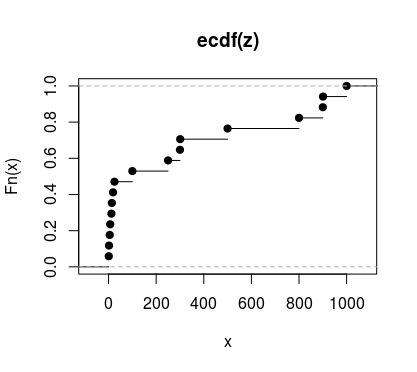
z <- c(1,2,5,7,12,14,19,25,100,250,300,301,500,800,900,901,1000)
plot(ecdf(z))

enter image description here

Notice that in the second example distances between different values are different so no matter that each value appeared only once, the line is curved.

$\endgroup$
0
3
$\begingroup$

You can think about it mechanically, too.

The ECDF $\hat F$ evaluated at $x$ is the proportion of observations with value $x$ or below. Since you have exactly 1,000 observations $\{y_i\}_{i=i}^{1000}$, the difference between $\hat F(y_i)$ and $\hat F(y_{i+1})$ is always 0.001 for any $1 \le i < 1000$.

Moreover, your sample values are evenly spaced, so the difference between $y_i$ and $y_{i+1}$ is always 1. Therefore, for any $1 \le i < 1000$, the slope between $\left(y_i, \hat F(y_i)\right)$ and $\left(y_{i+1}, \hat F(y_{i+1})\right)$ is always $\frac{0.001}{1}$. A curve with a constant slope is just a straight line.

As for what you're misunderstanding, the $Fn$ you defined is definitely not the right formula. The denominator should be the number of observations, and the numerator should be the number of observations with value at or below $x_n$.

$\endgroup$
2
$\begingroup$

The empirical distribution function of a sample $Y_1, ..., Y_n$ is defined as

$$ \widehat{F}(x) = \frac{1}{n} \sum_{i=1}^{n} \mathcal{I} \{ Y_i \leq x \} $$

In your data set, $Y_i = i$. So, $ \widehat{F}(x) = x/n$, for $x = 1, 2, ..., 1000$. Plotted the way you did, this looks like a linear function of $x$.

$\endgroup$
2
  • 1
    $\begingroup$ The final equation is incorrect. $\hat F$ is a step function, not a linear function. $\endgroup$
    – whuber
    Commented Jul 5, 2016 at 14:06
  • $\begingroup$ @whuber, I never did thank you for that astute, and very substantively important, correction to my answer. Keep up the good work. $\endgroup$
    – gammer
    Commented Jan 9, 2017 at 0:17

Your Answer

By clicking “Post Your Answer”, you agree to our terms of service and acknowledge you have read our privacy policy.

Not the answer you're looking for? Browse other questions tagged or ask your own question.