(ignore the R code if needed, as my main question is language-independent)
If I want to look at the variability of a simple statistic (ex: mean), I know I can do it via theory like:
x = rnorm(50)

# Estimate standard error from theory
summary(lm(x~1))
# same as...
sd(x) / sqrt(length(x))
or with the bootstrap like:
library(boot)

# Estimate standard error from bootstrap
(x.bs = boot(x, function(x, inds) mean(x[inds]), 1000))
# which is simply the standard *deviation* of the bootstrap distribution...
sd(x.bs$t)
However, what I'm wondering is, can it be useful/valid(?) to look to the standard error of a bootstrap distribution in certain situations? The situation I'm dealing with is a relatively noisy nonlinear function, such as:
# Simulate dataset
set.seed(12345)
n   = 100
x   = runif(n, 0, 20)
y   = SSasymp(x, 5, 1, -1) + rnorm(n, sd=2)
dat = data.frame(x, y)
Here the model doesn't even converge using the original data set,
> (fit = nls(y ~ SSasymp(x, Asym, R0, lrc), dat))
Error in numericDeriv(form[[3L]], names(ind), env) :
  Missing value or an infinity produced when evaluating the model
so the statistics I'm interested in instead are more stabilized estimates of these nls parameters - perhaps their means across a number of bootstrap replications.
# Obtain mean bootstrap nls parameter estimates
fit.bs = boot(dat, function(dat, inds)
              tryCatch(coef(nls(y ~ SSasymp(x, Asym, R0, lrc), dat[inds, ])),
                       error=function(e) c(NA, NA, NA)), 100)
pars = colMeans(fit.bs$t, na.rm=T)
Here these are, indeed, in the ball park of what I used to simulate the original data:
> pars
[1]  5.606190  1.859591 -1.390816
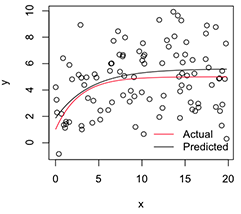
A plotted version looks like:
# Plot
with(dat, plot(x, y))

newx = seq(min(x), max(x), len=100)
lines(newx, SSasymp(newx, pars[1], pars[2], pars[3]))

lines(newx, SSasymp(newx, 5, 1, -1), col='red')
legend('bottomright', c('Actual', 'Predicted'), bty='n', lty=1, col=2:1)

Now, if I want the variability of these stabilized parameter estimates, I think I can, assuming normality of this bootstrap distribution, just calculate their standard errors:
> apply(fit.bs$t, 2, function(x) sd(x, na.rm=T) / sqrt(length(na.omit(x))))
[1] 0.08369921 0.17230957 0.08386824
Is this a sensible approach? Is there a better general approach to inference on the parameters of unstable nonlinear models like this? (I suppose I could instead do a second layer of resampling here, instead of relying on theory for the last bit, but that might take a lot of time depending on the model. Even still, I'm not sure if these standard errors would be useful for anything, since they would approach 0 if I just increase the number of bootstrap replications.)
Many thanks, and, by the way, I'm an engineer so please forgive me being a relative novice around here.
