3
$\begingroup$

I want to create a simple project to show about ESP.

I started with the idea of guessing whether a coin would be heads or tails.

I first wanted to show some values by pure guessing.

So, using random numbers of zero (tails) or heads (one), I generated 1000 pairs of these and put them in the first two columns of a spreadsheet. If the two values in the pair matched, I recorded it as a correct guess (a one in the third column of the spreadsheet) and if they didn't match, a zero.

I found the mean of the third column. It was approximately 0.5.

Then I took the standard deviation of this third column also. It's value was also close to 0.5 (about 0.49 or so).

I then took the mean plus two times the standard deviation which got me a value of about 1.5.

I did this because I was thinking this would show more than two standard deviations from the mean, which would be 95%. My idea was if someone could guess correctly above two standard deviations from the mean, that this would suggest unusual ability better than randomly guessing.

Then I realized that, for example, if someone guessed correctly ten times, that would be an average of 1 (from 10 / 10). But that will be less than 1.5 (the value from the mean of the random numbers plus two times their standard deviation). It would always be impossible to guess heads/tails and get 1.5 or better.

My friend suggested that I have to take the standard deviation value divided by the square root of 1000 (the number of trials). I don't know if this suggestion is right or not. If I do this, double it, and add it to the mean, I get a value of about 0.55. This suggests if a person guesses more than 55% correctly, this is above two standard deviations. I don't know if this is the right way or not, and why.

Thanks

$\endgroup$
0

2 Answers 2

4
$\begingroup$

The whole idea about taking two or three standard deviations from the mean comes from the normal distribution and the 68–95–99.7 rule (68% of the data lies within $\pm$1 sd, 95% lies within $\pm$2 sd etc.). However the main point about such rule is not about lying some number of standard deviations from the mean, but about the probability coverage. If you want to find some the values corresponding to some given probabilities, you should look at the quantile function of binomial distribution (distribution for number of successes in $n$ trials with given probability of success $p$).

Binomial distribution does not have a closed-form quantile function, but it is often implemented in most of the popular statistical packages, e.g. in R you can calculate the 95% probability coverage region by using

qbinom(c(0.025, 0.975), 1000, 0.5)
## [1] 469 531

so if you toss a coin 1000 times, you could expect with 95% probability to see between 469 and 531 heads.

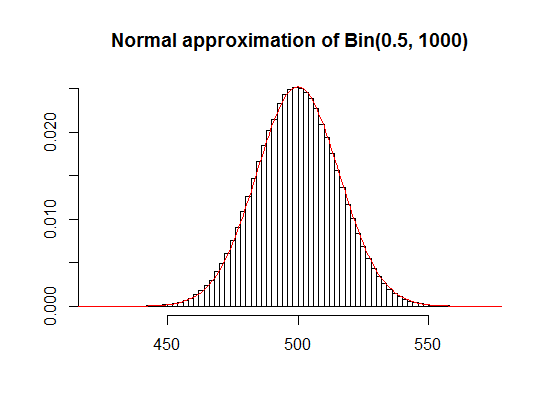
As noticed by Glen_b, since you are using quite large sample ($n=1000$), normal approximation of binomial distribution will extremely well in this case (see plot below).

Normal approximation of Bin(0.5, 1000)

It also gives you quite accurate estimates of the 95% region of the most probable number of heads in 1000 tosses:

qnorm(c(0.025, 0.975), 500, sqrt(1000*0.25))
## [1] 469.0102 530.9898
500 + c(-1, 1) * 2 * sqrt(1000*0.25) # mean -/+ 2SD
## [1] 468.3772 531.6228

However notice that this is just an approximation and in general if you don't need to use such approximations, you should rather look at the exact distribution that describes your data. It worked so well in here because the sample is large and the probability of success is not close to zero or one, but it doesn't have to be the case if those two conditions are not met.

Also notice that in real-life examples of coin tossing by different people, using different coins and experimental procedures, the results were indeed quite spread (but mostly fitted the 95% most probable region), so you should not understate the randomness -- you really should not expect to see exactly 500 heads in 1000 tosses since there is only a 0.025 probability for such event.

$\endgroup$
0
3
$\begingroup$

This simulation is a classic example of the Binomial Distribution––that is, if we assume each guess is independent and identical, then a purely random guesser would get $X$ guesses correct, where $X\sim Bin(n,p)$ with $n= 1000$ and $p = 0.5$.

According to the Binomial Distribution, we would expect this random guesser to get $np$ correct: $$E(X) = np = 500 $$ With a variance of: $$Var(X) = np(1-p) = 250$$ The standard deviation is just the square root of the variance: $$StdDev(X) = \sqrt{Var(X)} \approx 15.8$$ Now if you are looking to identify if someone is not purely guessing (perhaps they have ESP?), then you can use the 2-standard deviation threshold (as per the Normal Distribution Approximation) to determine if the guesser is not guessing at random (and be confident that we will only be wrong about 2.5% of the time). That is, if someone is able to guess more than $$500 + 2 * 15.8 = 531.6$$ of the coin flips ($\sim 53\%$), you can be fairly confident that they are not purely guessing (although this doesn't necessarily mean they have ESP!)

$\endgroup$
4
  • $\begingroup$ Rejecting the null is not the same as proving the alternative hypothesis. Such experiment would show that it'd be unlikely to happen when random guessing. $\endgroup$
    – Tim
    Commented Aug 1, 2016 at 7:03
  • $\begingroup$ I suggested this test based on the OP's original post, which seemed to be trying to do a test for statistical significance. Of course, by design, these tests do not prove the alternative, but merely reject the null hypothesis. Nowhere is this contradicted in my post (i.e. "you can be fairly confident that they are not purely guessing" $\equiv$ rejecting $H_0$) $\endgroup$
    – David C
    Commented Aug 1, 2016 at 18:01
  • 1
    $\begingroup$ @Tim is correct. To provide evidence of sameness (within some threshold defining a minimum relevant difference), you want to test for equivalence. $\endgroup$
    – Alexis
    Commented Feb 22, 2017 at 1:43
  • $\begingroup$ David C, you are leaving implicit the assumption of an $\alpha$ error rate of 0.05%. You probably want to make that explicit. $\endgroup$
    – Alexis
    Commented Feb 22, 2017 at 1:44

Your Answer

By clicking “Post Your Answer”, you agree to our terms of service and acknowledge you have read our privacy policy.

Not the answer you're looking for? Browse other questions tagged or ask your own question.