1
$\begingroup$

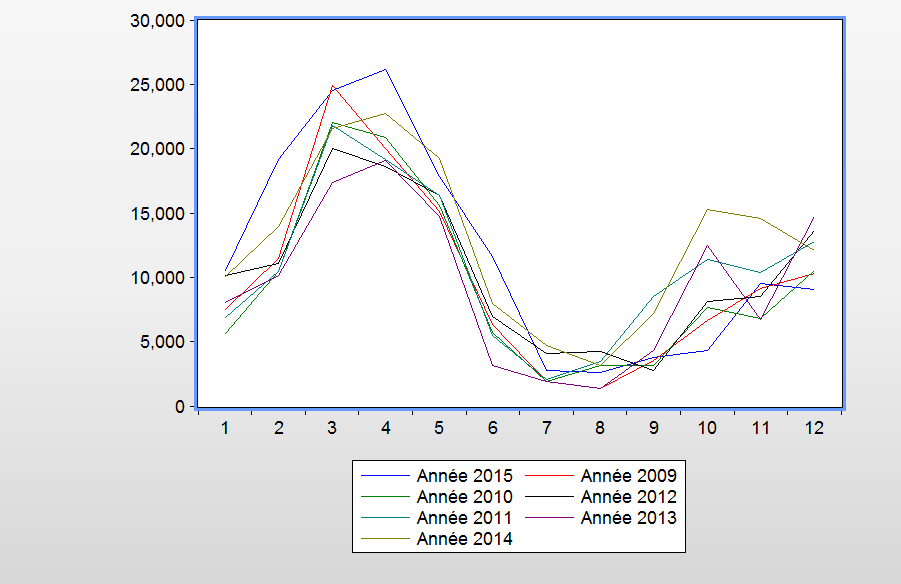
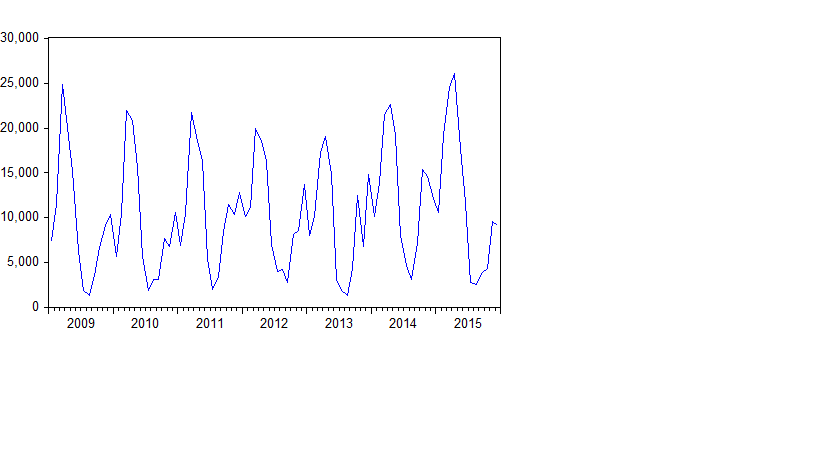
enter image description hereI have a monthly serie of the importation of apples. As I constructed the Buys-Ballot table, I found out that the serie is seasonal, in March for four years and in April for the later three years. What to do to deseasonal it since the seasonal month has changed??

enter image description here

$\endgroup$
11
  • $\begingroup$ Could you include a plot of your data, preferably arranged by seasons? It can be done, for example, using the function seasonplot from the "forecast" package in R. Extra to that, you could also include some numerical measures of seasonality if you have obtained any so far. $\endgroup$ Commented Aug 3, 2016 at 16:51
  • $\begingroup$ I've added the plot. I'm using eviews, not R $\endgroup$
    – user109464
    Commented Aug 3, 2016 at 17:22
  • $\begingroup$ Then could you plot the twelve months of 2009, then the twelve months of 2010 on top in the same graph, then 2011 on top and so on (probably using different colours)? From the current graph it appears that not only March/April but also other months are somehow special, i.e. the seasonal pattern does not only have one spike per year and a flat line for the rest of the year. If you want to seasonally adjust the data, you could just use monthly dummies, for example. Of course, if the seasonal month has changed, probably you need a more advanced approach. $\endgroup$ Commented Aug 3, 2016 at 17:33
  • $\begingroup$ Thank you! Looks like simple dummies could work alright. The fact that the peak month has changed recently is somewhat worrying, but the change does not seem to be very large. You could, for example, weight the different years differently (assign larger weights for more recent years). It should work fine. $\endgroup$ Commented Aug 3, 2016 at 17:56
  • $\begingroup$ Sorry I've studied seasonal adjustment in french, my english is not good. Can you briefly explain what is "Simple dummies", "weight" ?? $\endgroup$
    – user109464
    Commented Aug 3, 2016 at 18:04

2 Answers 2

2
$\begingroup$

You can seasonal adjust the data with X-13ARIMA-SEATS. X-13ARIMA-SEATS is a pretty powerful tool and deals with changing seasonal patterns. You can get the X-13ARIMA-SEATS fortan libraries from the US Census Bureau here, but most statistical software include a wrapper around the X-13ARIMA-SEATS program. It should be fairly easy to implement.

$\endgroup$
0
$\begingroup$

If you suspect the month has changed, and you know the change is in year 4, then you can add the month dummies Richard suggested. You will do a better job by adding interaction terms also, i.e. regress the seasonal variable on month dummies (denoted i.month) and interaction terms (A x i.month) and (B x i.month) where A = 1 if year <= 4, 0 otherwise, and B = 1 if year > 4, 0 otherwise. That way you will capture the shift in the seasonality.

$\endgroup$

Your Answer

By clicking “Post Your Answer”, you agree to our terms of service and acknowledge you have read our privacy policy.

Not the answer you're looking for? Browse other questions tagged or ask your own question.