8
$\begingroup$

My question builds on a previous post on outlier detection in generic time series, and specifically on the answer provided by the always great Rob H.

I work for a small-sized manufacturing company that currently handles the issue, i.e. detecting outliers in sales data time series, employing a (dubious) automated off-the-shelf software procedure.

I think this kind of approach is questionable at best and, more often than not, I'm not happy with the results I get. I would therefore like to "double check" the output from our software using some alternative method.

Rob's idea seemed reasonable, straightforward and easy to implement, so I decided to give it a try. Question is: what if my time series are not "generic"?

Stl decomposition highlights a strong seasonality and a varying trend in my data:
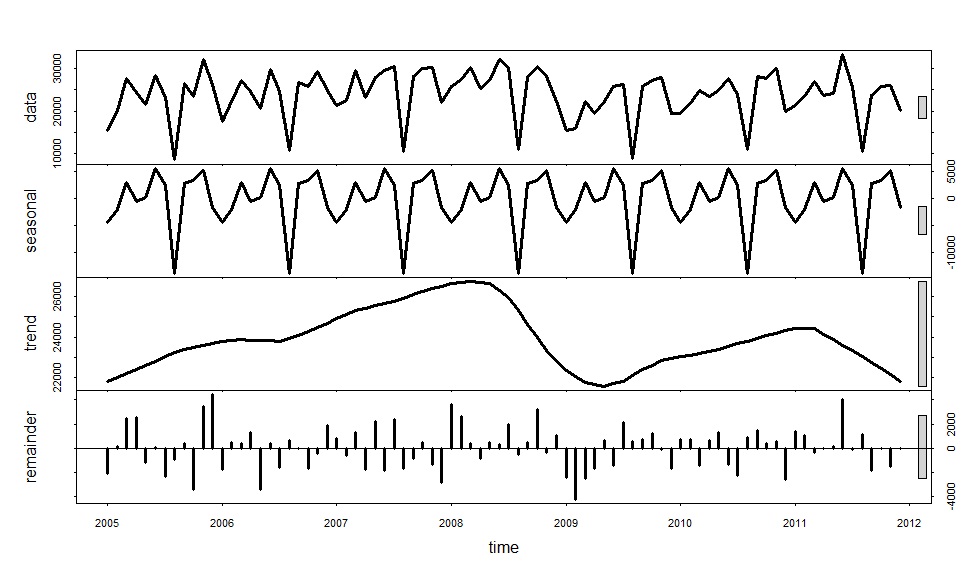
enter image description here

(BTW I used stl(x,s.window="periodic") like Rob suggested, but IMHO stl(x,s.window="periodic",robust=TRUE) would be a better choice since outlier detection is the issue at hand here. Also I'm not really sure about the s.window="periodic" part, I tried experimenting with different values a bit, but I don't know how to interpret results. Maybe someone can point me in the right direction?).

Back to my question, mine being sales data, the seasonal pattern is (or I think it is) strongly affected by calendar effects. Also I have reason to believe the big level shift in 2009 is due to the financial crisis and it has nothing to do with trend.

What do I do here? Should I let the model handle this, or should I pre-process data? Do I perform working-day adjustment and re-allign (is there such a thing?) before-2009 and after-2009 data, or do I let STL decomposition do the work?

I could write another 1000 lines, but I think this should be enough to get the message through. I apologize for the WOT and for my bad english. Also I hope I did not break too many forum rules...

I hope someone out there can help!

$\endgroup$
7
  • $\begingroup$ If you fit one time-series to the pre-shift data in 2009 and a separate series to the post-shift data, what do your two times series look like? You could have a structural break which means that there is a different model for the newer data. $\endgroup$
    – Michelle
    Commented Feb 16, 2012 at 19:31
  • $\begingroup$ Oooh, interesting, so it could be more than a simple level shift. I never thought of this. So I try STL decomposition before and after 2009 to see what changes? And what about seasonality? I can't understand if calendar effects are supposed to be part of seasonal component or not... Would it help if I posted the values of my time serie? $\endgroup$
    – Bruder
    Commented Feb 16, 2012 at 19:37
  • $\begingroup$ A structural break can affect seasonality as well, but it depends on the underlying data (e.g. military changing their intake numbers and time of year!). For seasonality, is there any theory behind those effects, e.g. you're selling winter clothing, or people tend to buy the products on the weekend, etc? The last time I used it, stl kept the same seasonality trend across all data - this may be an incorrect assumption. $\endgroup$
    – Michelle
    Commented Feb 16, 2012 at 19:41
  • $\begingroup$ There is no underlying seasonality effect i can think of. We sell circuit breakers so... There is a valley in August and December because the factory shuts down for summer/winter holidays. I thought calendar adjustment would get rid of that effect, but the adjusted data still exhibit a some lower than average values. I guess people tend to buy less in those months because they know the company will close and so they'll have to wait longer for their product. They stock up in July and November and refill in September/January. But that's only a wild guess. $\endgroup$
    – Bruder
    Commented Feb 16, 2012 at 21:14
  • $\begingroup$ Above time serie goes from Jan 2005 to Dec 2011 $\endgroup$
    – Bruder
    Commented Feb 16, 2012 at 21:18

3 Answers 3

6
$\begingroup$
  • The smooth trend should cope with economic effects without any trouble.
  • Using robust=TRUE in stl makes sense here (and I've changed my original function to do the same).
  • Unless you have more than ten years of data, I would stick with periodic seasonality. It is unlikely to change fast enough to detect with shorter time series.
  • Pre-processing the data for working days makes sense as it removes known causes of variability.

I suggest you try the stl approach and look at where it gives very different results from your existing method. Then look at those cases and see which method is giving the most sensible results.

I would not go the ARIMA route as it is nowhere near as robust as stl.

$\endgroup$
2
  • $\begingroup$ Rob - thank you for adressing my problems so specifically, your answer was very clear. Just out of curiosity, how would you reply to what Michelle suggested regarding the possibility of a structural break before and after 2009? Do you think the approach suggested (i.e. breaking the serie in two and running two separate stl decompositions) is viable? $\endgroup$
    – Bruder
    Commented Feb 17, 2012 at 13:05
  • 1
    $\begingroup$ Rather than complicate things with two separate decompositions, I would reduce the t.window to allow a more sudden change if you think the default value is smoothing it out. $\endgroup$ Commented Feb 18, 2012 at 7:14
4
$\begingroup$

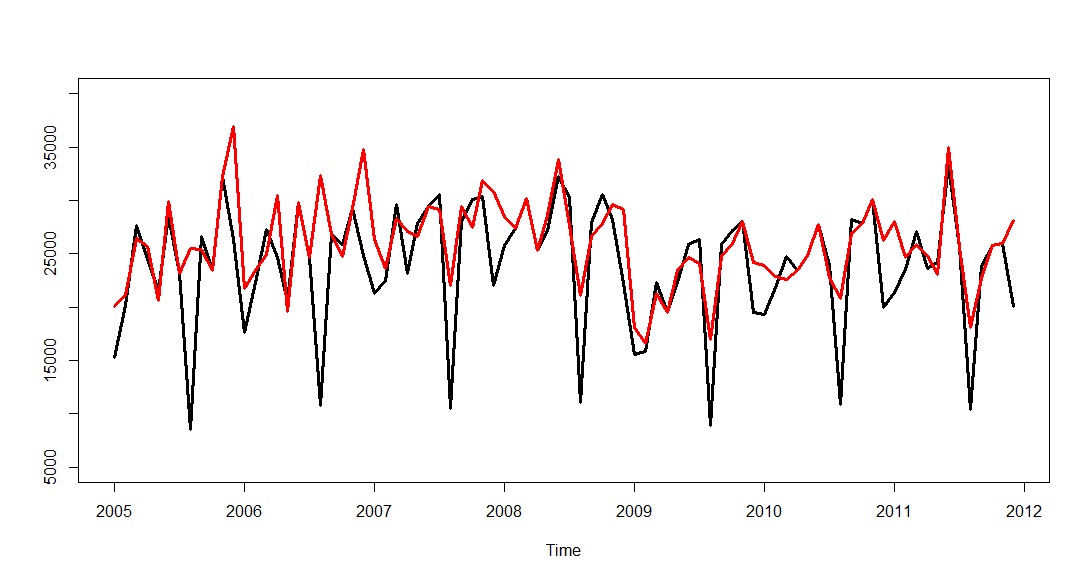
Ok now, let's try this for comparison. What if I remove calendar effects by dividing the original time serie by the number of actual working days in each month and then I multyply the results by 21?

The original time-serie is in black, and the calendar-adjusted one is in red: enter image description here

The first thing that popped into my mind is: hey, are these data really seasonal? August might be, but what about November/December? It seems to me that working-day adjustment cancels out most, if not all, of the seasonality for the winter months. How do you guys see it?

On top of that: I still notice the pulse in Nov'05 and Jan'09, I'm not really sure about May'06 and it seems to me like Jan'08 might have been more of a matter related to working days than to an actual pulse.

Also, I can totally see the level shift in Feb'09, but what about the one in Dec'06? Isn't it more like a side-effect of the Nov'06 pulse (is Nov'06 even a pulse considering calendar-adjusted data)? The serie went up so high that, when it came back down, it seemed like a shift in level. Does the pulse-adjusted data still generate a level shift warning in Dec'06?

Again, the idea here is to try and see if pre-processing of data might actually improve correct outlier identification. I think a side-by-side test like this might help. IrishStats (or anyone else) care to accept the challenge? :-)

$\endgroup$
5
  • $\begingroup$ :Bruder Yes the pulse adjusted data suggests a Level Shift at Dec 06.The more ad hoc fudging/adjusting the less scientific/objective are your results.Historical or might I say hysterical procedures often suggested presumptive arithmetic manipulations. Rather than a sequence of unverified presumptions , the approach I laid out is a comprehensive one.Note that many time series often require seasonal ARIMA before Intervention Detection can be applied to detect omitted deterministic structure e.g. the Airline Series.In your case the seasonality is deterministic/fixed effects for different months. $\endgroup$
    – IrishStat
    Commented Feb 17, 2012 at 11:21
  • $\begingroup$ :Bruder I tried to take our "discussion" to a chat room but you don;t have enough "seniority" . If you want to contact me off line please do so and I will try and explain in simple/plain english terms what Tsay pointed out in mathematical terms. $\endgroup$
    – IrishStat
    Commented Feb 17, 2012 at 13:35
  • $\begingroup$ @IrishStat - I would love that, it's more than I could hope for! Hopefully I'll soon be able to acquire 5 more reputation points so we can chat. I'll get back to you when I do! :) $\endgroup$
    – Bruder
    Commented Feb 18, 2012 at 10:34
  • $\begingroup$ I created a chat room for this comment thread at chat.stackexchange.com/rooms/2579/…. $\endgroup$
    – whuber
    Commented Feb 22, 2012 at 21:43
  • $\begingroup$ :whuber thanks! How do I know when bruder is available to chat ? $\endgroup$
    – IrishStat
    Commented Feb 24, 2012 at 14:24
3
$\begingroup$

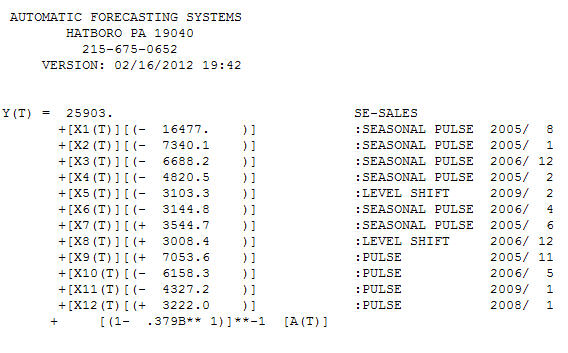
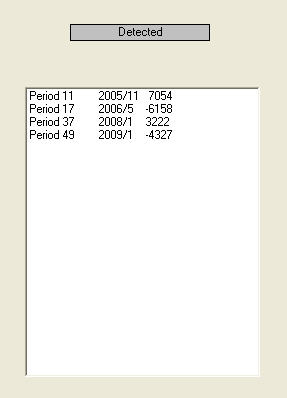
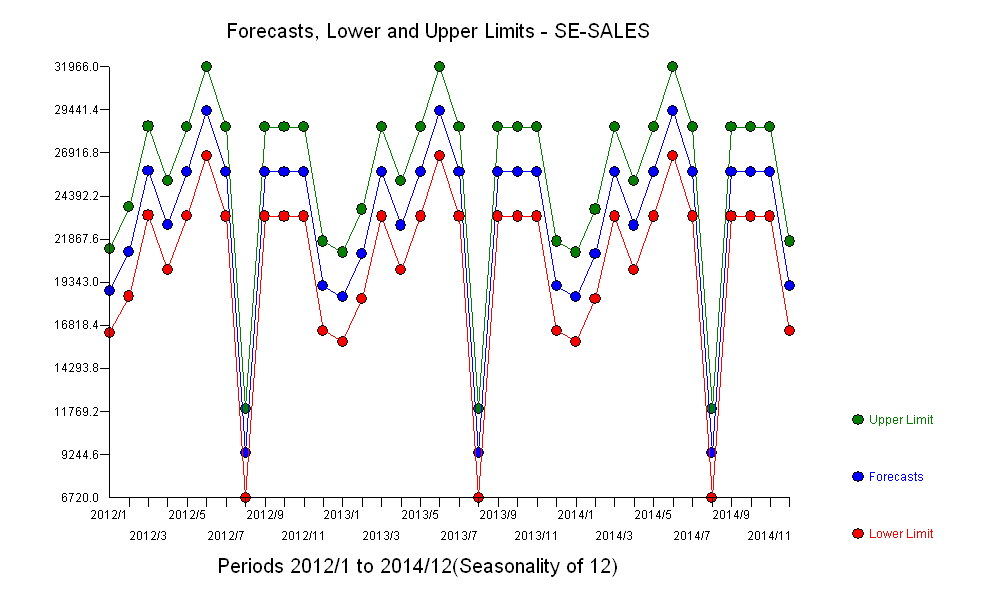
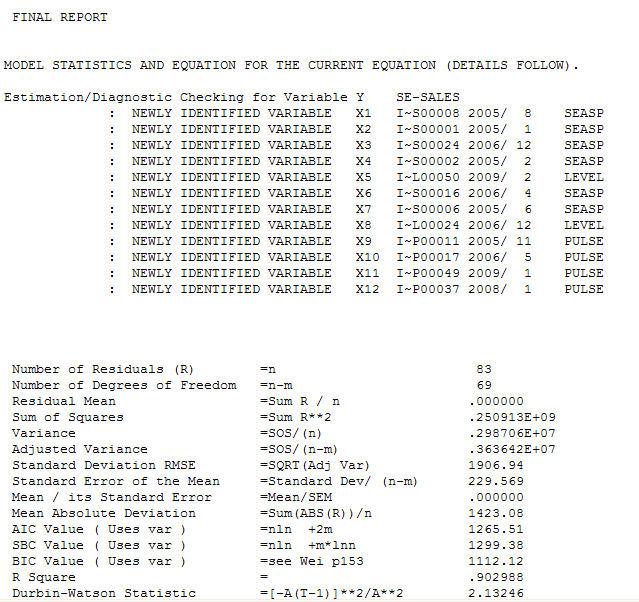
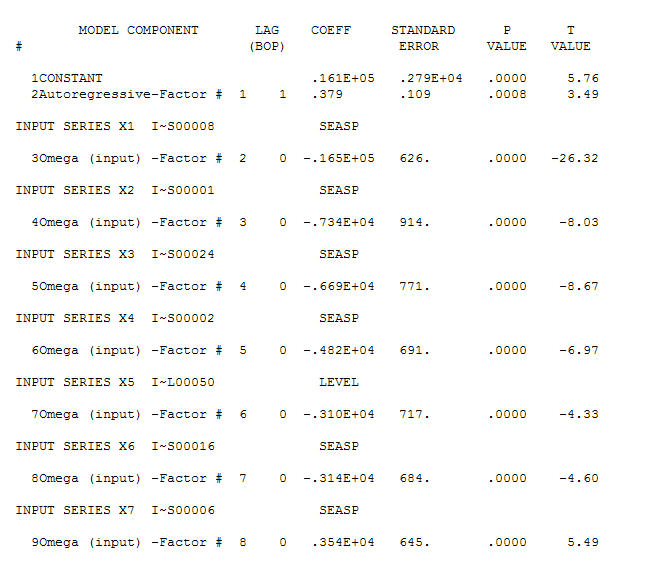
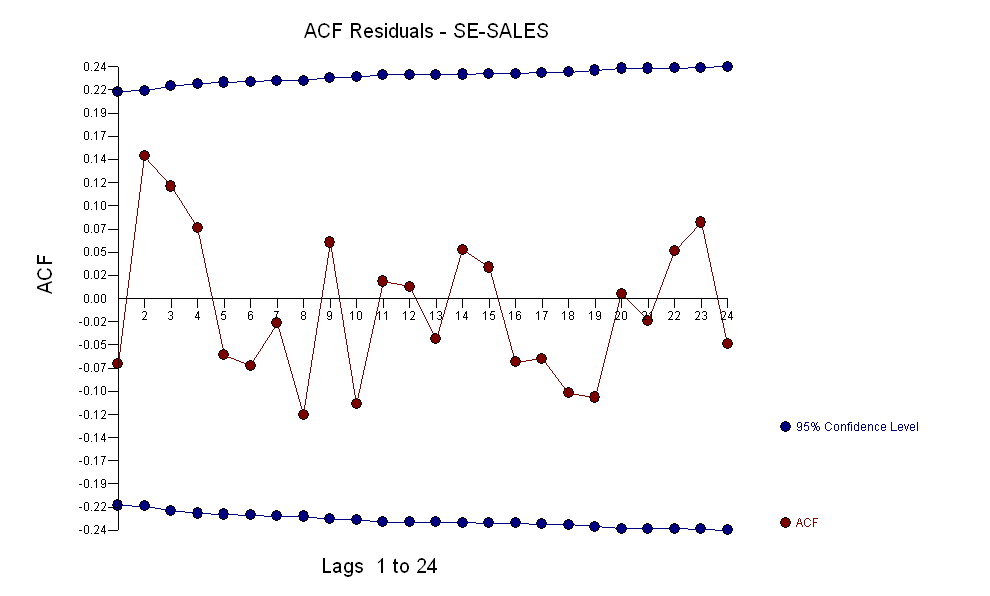
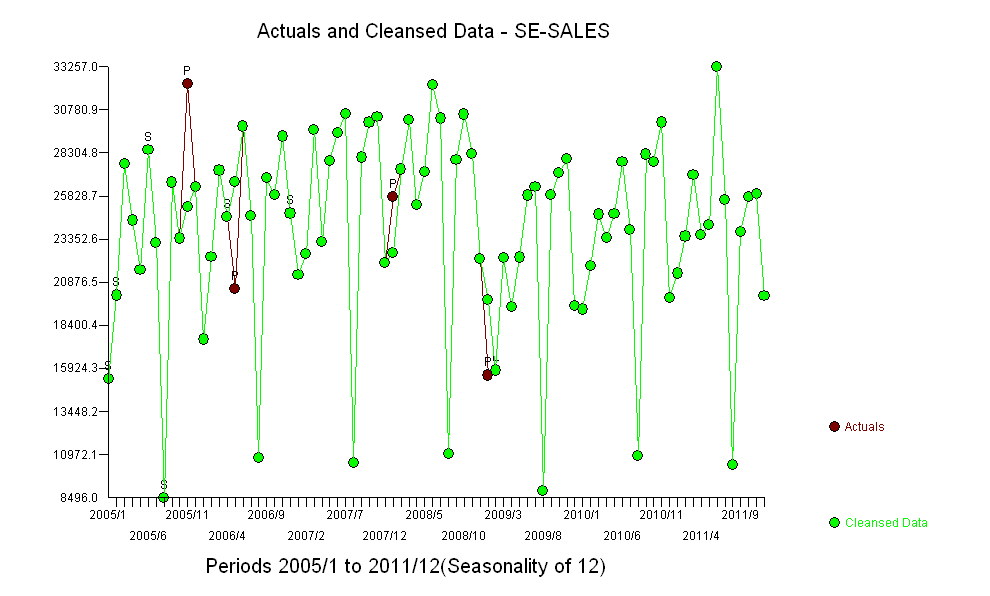
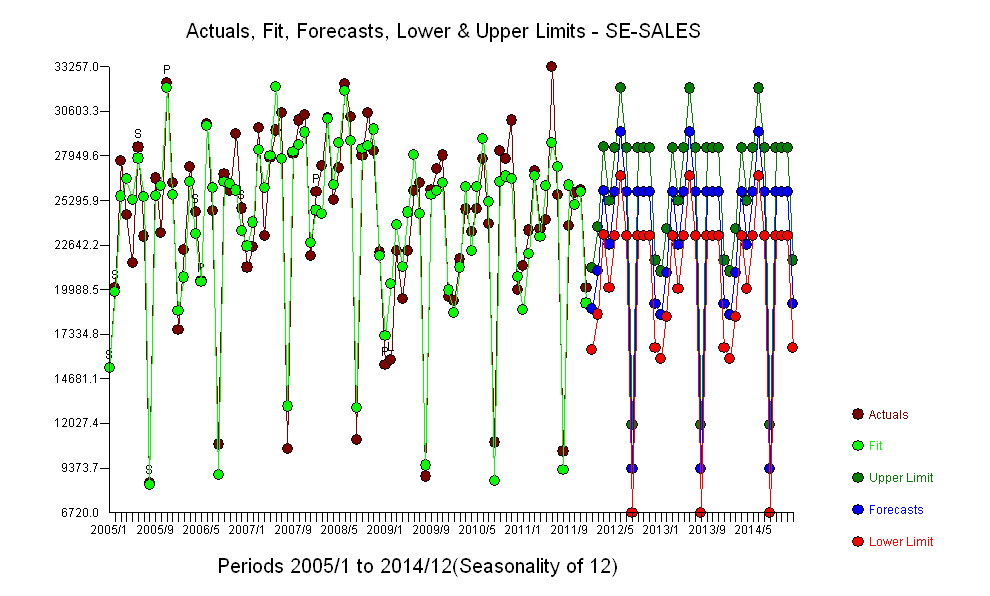
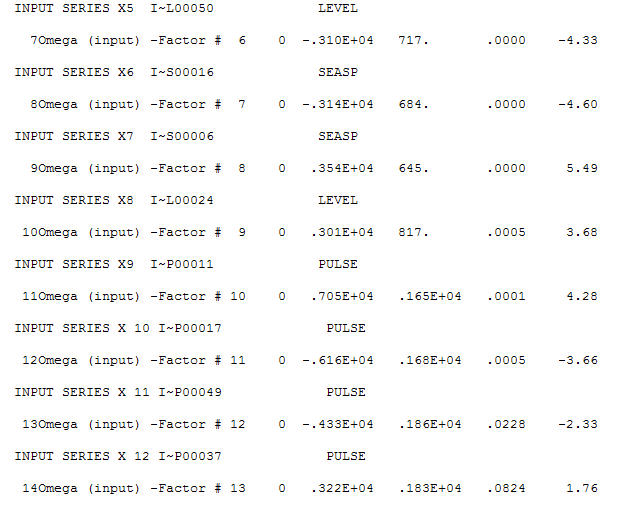
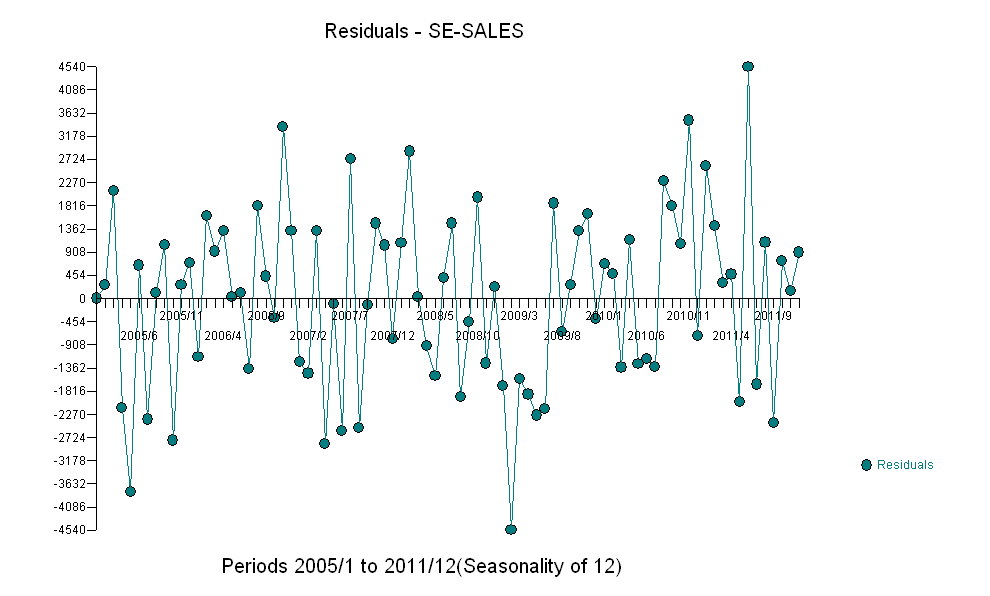
The problem/opportunity is to identify the underlying ARIMA or Seasonal Dummy Model and augment as needed . This particular series evidences string / dominant determinstic seasona dummies as compared to a seasonal ARIMA structure. We then identify both unusual values be they pulses, seasonal pulses, level shifts and or local time trends AND and autoregressive structure needed to generate "noise". Two Level Shifts were identified on or around time period 50 (2009/February) and period 24 (2006/December). The data suggested the following model enter image description here . The unusual values i.e. the PULSES enter image description here are listed here. A very illuminating graphic is the cleansed vs the actual shown hereenter image description here . Finally the fit/actual/forecast graph is a good ( but busy ) summaryenter image description here . The forecast graph is enter image description here . The final model statistics are shown in the last three images and enter image description here and enter image description here and enter image description here . The residuals from the model are reasonably random enter image description here with no remaining autoenter image description herecorrelative structure . Hope this little example helps all ! I am one of the developers of the software I used here . There are other commercially available products that will deliver something similar.
$\endgroup$
6
  • $\begingroup$ Thank you for your answer IrishStat, I find it very very interesting! What's even more interesting to me is the fact that you did not need me to provide the number of working days in each month. So I guess the answer to my original question is: no, you don't need to pre-process data. A complex enough model can handle that already. Is this correct? As for outliers spotting, do I then apply Rob's method to the residuals you obtained, or are the "outliers" already taken care of when you cleansed the data from "pulses"? $\endgroup$
    – Bruder
    Commented Feb 17, 2012 at 8:12
  • $\begingroup$ There are only 4 outliers/inliers/pulses in this model (periods 11,17,37 and 49). The only treatment I know is to examine these periods for possible "assignable cause" in order to possible evolve/deduce an unspecified predictor/exogenous series that was not incorporated/omitted from the model. In summary the outliers have been cleansed thus providing robust estimates of the other parameters. $\endgroup$
    – IrishStat
    Commented Feb 17, 2012 at 10:38
  • 1
    $\begingroup$ Again, thank you for your reply. Could you please provide more details about the cleansing process? How were the cleansed values actually computed? (BTW I'm now reading your AutoBox User's Giude, maybe I'll find some info in there?). Also what happened to level shifts? Shouldn't these be somehow incorporated in the model? Or am I missing something? I apologize for my lack of knowledge on this topic... $\endgroup$
    – Bruder
    Commented Feb 17, 2012 at 11:29
  • $\begingroup$ :Bruder A good reference for this is unc.edu/~jbhill/tsay.pdf . Level Shifts were incorporated into the model (level shift at 24 and at 50 ) . At 24 the series went up and at 50 it went down . $\endgroup$
    – IrishStat
    Commented Feb 17, 2012 at 11:59
  • $\begingroup$ :Bruder Note that six months of the year are earmarked for specific effects month 8/1/12/2/4 and 6. The starting date for these fixed effects are respectively 2005/8 ; 2005/1 ; 2006/12 ; 2005/2 ; 2006/4 and 2005/6 . What this means is that rather than assuming that the fixed effects (i.e. monthly effects ) are uniform over time , it is possible to detect the "onset" of these effects. It is quite naive to assume that the impact of a particular month is uniform through the 7 years. In terms of the ARIMA component , a lag of one was found which suggests an effect from the prior period's sales. $\endgroup$
    – IrishStat
    Commented Feb 17, 2012 at 12:23

Your Answer

By clicking “Post Your Answer”, you agree to our terms of service and acknowledge you have read our privacy policy.

Not the answer you're looking for? Browse other questions tagged or ask your own question.